Revance Therapeutics (RVNC): A Smart Investment or a Value Trap? An In-Depth Exploration
For value-focused investors, stocks priced below their intrinsic value are always a lure. Revance Therapeutics Inc (NASDAQ:RVNC), a biotechnology company specialized in aesthetic and therapeutic offerings, is one such stock that has caught the attention of many. Currently priced at $16.68, the stock has recorded a loss of 4.66% in a day and a 3-month decrease of 45.94%. According to its GF Value, the fair valuation of Revance Therapeutics (NASDAQ:RVNC) is $46.93.
Understanding GF Value
The GF Value is a unique method that calculates the current intrinsic value of a stock. It is based on three key factors: historical multiples (PE Ratio, PS Ratio, PB Ratio and Price-to-Free-Cash-Flow) that the stock has traded at, GuruFocus adjustment factor based on the company's past returns and growth, and future estimates of the business performance. The GF Value Line is the fair value that the stock should be traded at. If the stock price is significantly above the GF Value Line, it is overvalued and its future return is likely to be poor. Conversely, if it is significantly below the GF Value Line, its future return will likely be higher.
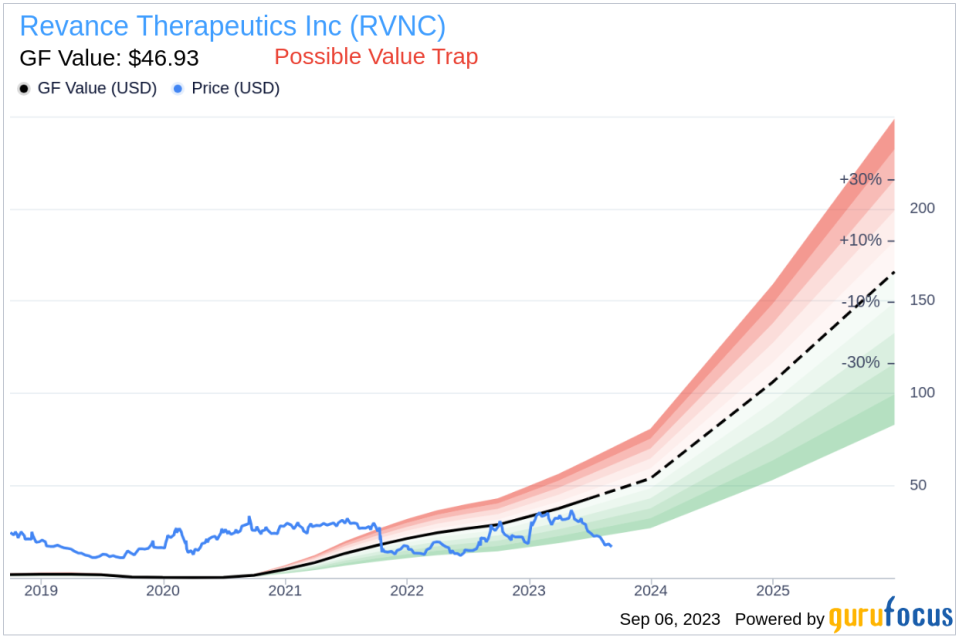
However, an in-depth analysis is necessary before making an investment decision. Despite its seemingly attractive valuation, certain risk factors associated with Revance Therapeutics (NASDAQ:RVNC) should not be ignored. These risks are primarily reflected through its low Altman Z-score of -3.67, and a Beneish M-Score of -1.76 that exceeds -1.78, the threshold for potential earnings manipulation. These indicators suggest that Revance Therapeutics, despite its apparent undervaluation, might be a potential value trap. This complexity underlines the importance of thorough due diligence in investment decision-making.
Understanding Key Financial Indicators
The Altman Z-score is a financial model that predicts the probability of a company entering bankruptcy within a two-year time frame, combining five different financial ratios each weighted to create a final score. A score below 1.8 suggests a high likelihood of financial distress, while a score above 3 indicates a low risk.
The Beneish M-Score is a model based on eight financial variables that reflect different aspects of a company's financial performance and position. These are Days Sales Outstanding (DSO), Gross Margin (GM), Total Long-term Assets Less Property, Plant and Equipment over Total Assets (TATA), change in Revenue (?REV), change in Depreciation and Amortization (?DA), change in Selling, General and Admin expenses (?SGA), change in Debt-to-Asset Ratio (?LVG), and Net Income Less Non-Operating Income and Cash Flow from Operations over Total Assets (?NOATA).
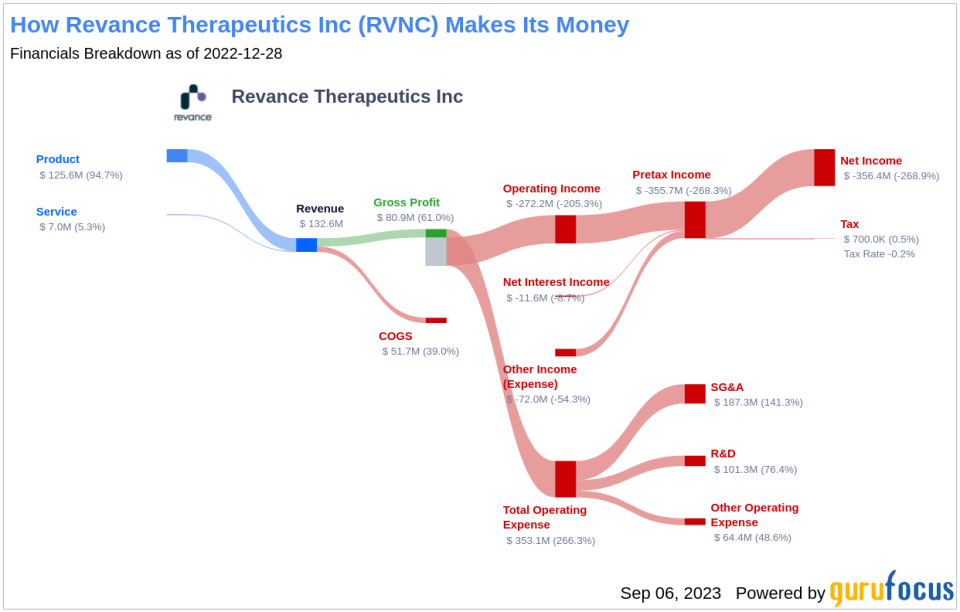
Revance Therapeutics: A Closer Look
Revance Therapeutics Inc is a biotechnology company focused on aesthetic and therapeutic offerings, including its neuromodulator product, DaxibotulinumtoxinA for Injection. The company has launched a prestige aesthetics portfolio, which includes the RHA Collection of dermal fillers and the HintMD platform. Its main products include DaxibotulinumtoxinA for Injection and DaxibotulinumtoxinA for Injection Aesthetics. The operating business segments are the Product and the Service Segment. The Products segment generates maximum revenue and is engaged in the research and development of aesthetic and therapeutic products.
Breaking Down Revance Therapeutics's Low Altman Z-Score
An analysis of Revance Therapeutics's Altman Z-score reveals that the company's financial health may be weak, suggesting possible financial distress:
The Retained Earnings to Total Assets ratio provides insights into a company's capacity to reinvest its profits or manage debt. Evaluating Revance Therapeutics's historical data, 2021: -1.97; 2022: -2.71; 2023: -3.15, we observe a declining trend in this ratio. This downward movement indicates Revance Therapeutics's diminishing ability to reinvest in its business or effectively manage its debt. Consequently, it exerts a negative impact on its Z-Score.
The Gross Margin index tracks the evolution of a company's gross profit as a proportion of its revenue. A downward trend could indicate issues such as overproduction or more generous credit terms, both of which are potential red flags for earnings manipulation. By examining the past three years of Revance Therapeutics's historical data (2021: 69.43; 2022: 68.61; 2023: 61.52), we find that its Gross Margin has contracted by 34.4%. Such a contraction in the gross margin can negatively impact the company's profitability as it signifies lesser income from each dollar of sales. This could put a strain on the company's capacity to manage operating costs, potentially undermining its financial stability.
The asset quality ratio, calculated as Total Long-term Assets minus Property, Plant, and Equipment, divided by Total Assets, gauges the proportion of intangible or less tangible assets within a company's asset structure. Analyzing Revance Therapeutics's asset quality ratio over the past three years (2021: 0.34; 2022: 0.39; 2023: 0.24), an increase might signal underlying issues, such as capitalizing normal operating expenses or goodwill impairment. These factors can inflate assets and mask true operational costs, potentially misrepresenting the company's actual financial position, and raising concerns for investors about its true value and risk profile.
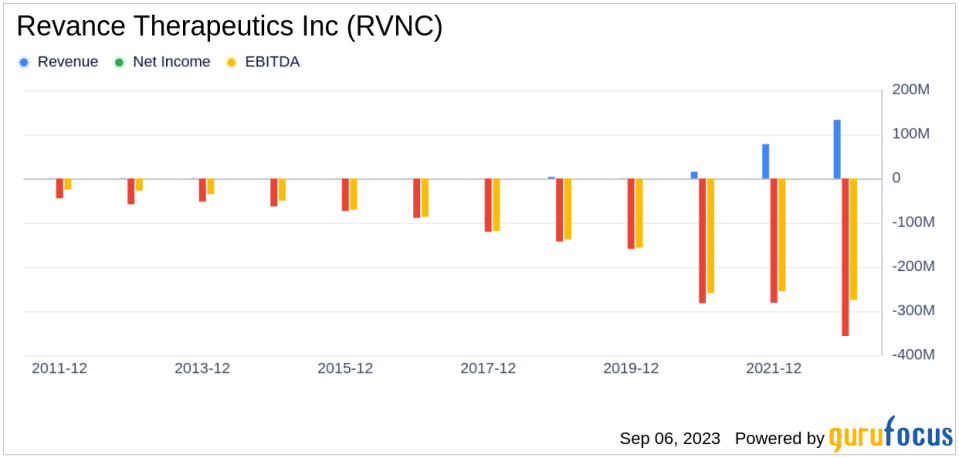
The Year-Over-Year (YoY) change in Revenue calculates the percentage difference in sales between the previous year and the current year. A notable upswing in this ratio could potentially signal aggressive income recognition or sales manipulation tactics. Delving into Revance Therapeutics's revenue data over the past three years (2021: 47.07; 2022: 99.32; 2023: 186.40), it's apparent that there has been a significant surge in revenue in the last 12 months, with a rise of 111.00 %.
The leverage index, which is computed as the change in the Debt-to-Asset Ratio, may suggest that the company is taking on more debt, thereby potentially inflating earnings.
Conclusion: Is Revance Therapeutics a Value Trap?
Despite its seemingly attractive valuation, the low Altman Z-Score and high Beneish M-Score of Revance Therapeutics suggest potential financial distress and earnings manipulation, respectively. These factors indicate that Revance Therapeutics may be a potential value trap, underlining the importance of thorough due diligence in investment decision-making. As always, investors are advised to conduct their own comprehensive analysis before making investment decisions.
GuruFocus Premium members can find stocks with high Altman Z-Score using the Walter Schloss Screen . To find out the high quality companies that may deliver above average returns, please check out GuruFocus High Quality Low Capex Screener.
This article first appeared on GuruFocus.
