Richmond Mutual Bancorporation (NASDAQ:RMBI) shareholders have endured a 22% loss from investing in the stock a year ago
Richmond Mutual Bancorporation, Inc. (NASDAQ:RMBI) shareholders should be happy to see the share price up 15% in the last month. But in truth the last year hasn't been good for the share price. After all, the share price is down 25% in the last year, significantly under-performing the market.
So let's have a look and see if the longer term performance of the company has been in line with the underlying business' progress.
View our latest analysis for Richmond Mutual Bancorporation
While the efficient markets hypothesis continues to be taught by some, it has been proven that markets are over-reactive dynamic systems, and investors are not always rational. One way to examine how market sentiment has changed over time is to look at the interaction between a company's share price and its earnings per share (EPS).
Even though the Richmond Mutual Bancorporation share price is down over the year, its EPS actually improved. It's quite possible that growth expectations may have been unreasonable in the past.
It's fair to say that the share price does not seem to be reflecting the EPS growth. So it's easy to justify a look at some other metrics.
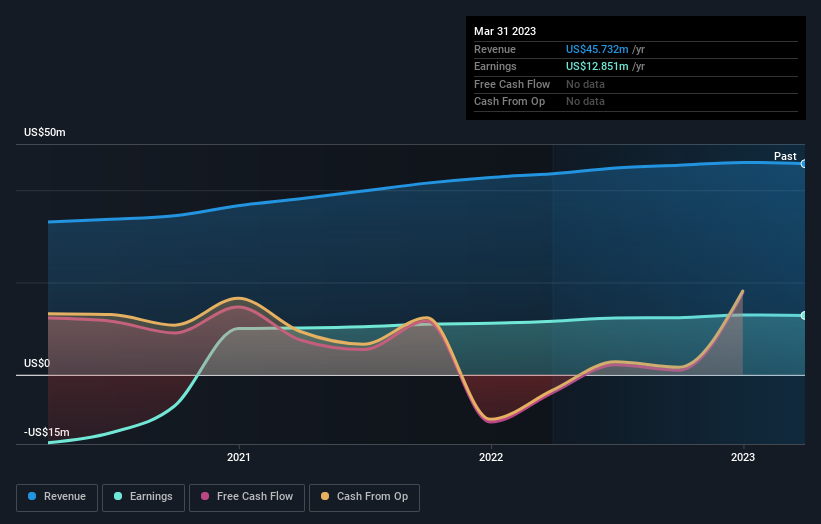
We don't see any weakness in the Richmond Mutual Bancorporation's dividend so the steady payout can't really explain the share price drop. The revenue trend doesn't seem to explain why the share price is down. Unless, of course, the market was expecting a revenue uptick.
The graphic below depicts how earnings and revenue have changed over time (unveil the exact values by clicking on the image).
This free interactive report on Richmond Mutual Bancorporation's balance sheet strength is a great place to start, if you want to investigate the stock further.
What About Dividends?
It is important to consider the total shareholder return, as well as the share price return, for any given stock. The TSR is a return calculation that accounts for the value of cash dividends (assuming that any dividend received was reinvested) and the calculated value of any discounted capital raisings and spin-offs. It's fair to say that the TSR gives a more complete picture for stocks that pay a dividend. We note that for Richmond Mutual Bancorporation the TSR over the last 1 year was -22%, which is better than the share price return mentioned above. And there's no prize for guessing that the dividend payments largely explain the divergence!
A Different Perspective
The last twelve months weren't great for Richmond Mutual Bancorporation shares, which cost holders 22%, including dividends, while the market was up about 5.6%. However, keep in mind that even the best stocks will sometimes underperform the market over a twelve month period. Fortunately the longer term story is brighter, with total returns averaging about 5% per year over three years. Sometimes when a good quality long term winner has a weak period, it's turns out to be an opportunity, but you really need to be sure that the quality is there. While it is well worth considering the different impacts that market conditions can have on the share price, there are other factors that are even more important. To that end, you should be aware of the 1 warning sign we've spotted with Richmond Mutual Bancorporation .
For those who like to find winning investments this free list of growing companies with recent insider purchasing, could be just the ticket.
Please note, the market returns quoted in this article reflect the market weighted average returns of stocks that currently trade on American exchanges.
Have feedback on this article? Concerned about the content? Get in touch with us directly. Alternatively, email editorial-team (at) simplywallst.com.
This article by Simply Wall St is general in nature. We provide commentary based on historical data and analyst forecasts only using an unbiased methodology and our articles are not intended to be financial advice. It does not constitute a recommendation to buy or sell any stock, and does not take account of your objectives, or your financial situation. We aim to bring you long-term focused analysis driven by fundamental data. Note that our analysis may not factor in the latest price-sensitive company announcements or qualitative material. Simply Wall St has no position in any stocks mentioned.
Join A Paid User Research Session
You’ll receive a US$30 Amazon Gift card for 1 hour of your time while helping us build better investing tools for the individual investors like yourself. Sign up here
