A Rising Share Price Has Us Looking Closely At MOQ Limited's (ASX:MOQ) P/E Ratio

Those holding MOQ (ASX:MOQ) shares must be pleased that the share price has rebounded 38% in the last thirty days. But unfortunately, the stock is still down by 31% over a quarter. But shareholders may not all be feeling jubilant, since the share price is still down 31% in the last year.
All else being equal, a sharp share price increase should make a stock less attractive to potential investors. While the market sentiment towards a stock is very changeable, in the long run, the share price will tend to move in the same direction as earnings per share. So some would prefer to hold off buying when there is a lot of optimism towards a stock. One way to gauge market expectations of a stock is to look at its Price to Earnings Ratio (PE Ratio). Investors have optimistic expectations of companies with higher P/E ratios, compared to companies with lower P/E ratios.
See our latest analysis for MOQ
Does MOQ Have A Relatively High Or Low P/E For Its Industry?
MOQ's P/E is 36.44. The image below shows that MOQ has a P/E ratio that is roughly in line with the software industry average (35.6).
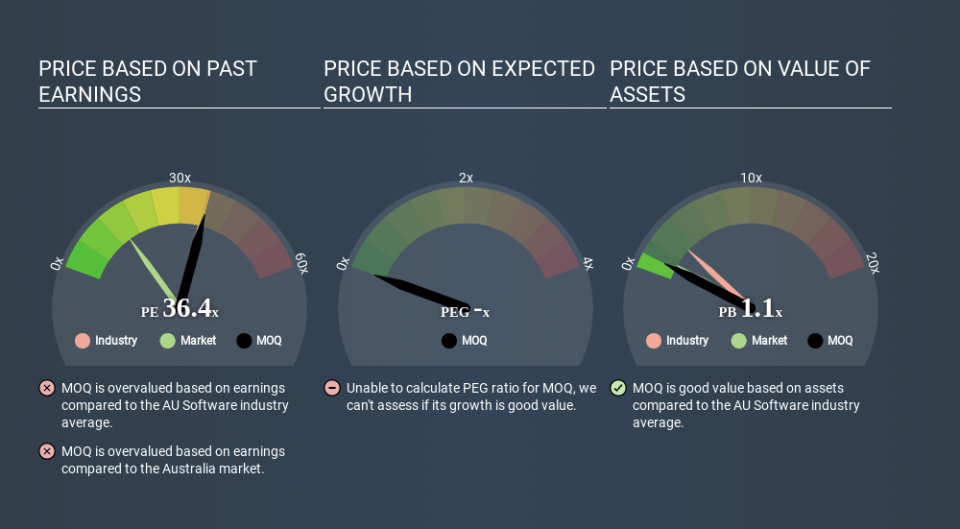
That indicates that the market expects MOQ will perform roughly in line with other companies in its industry. The company could surprise by performing better than average, in the future. Further research into factors such as insider buying and selling, could help you form your own view on whether that is likely.
How Growth Rates Impact P/E Ratios
Probably the most important factor in determining what P/E a company trades on is the earnings growth. That's because companies that grow earnings per share quickly will rapidly increase the 'E' in the equation. That means unless the share price increases, the P/E will reduce in a few years. So while a stock may look expensive based on past earnings, it could be cheap based on future earnings.
MOQ's earnings per share fell by 59% in the last twelve months. But EPS is up 27% over the last 3 years.
Don't Forget: The P/E Does Not Account For Debt or Bank Deposits
Don't forget that the P/E ratio considers market capitalization. Thus, the metric does not reflect cash or debt held by the company. Hypothetically, a company could reduce its future P/E ratio by spending its cash (or taking on debt) to achieve higher earnings.
Such spending might be good or bad, overall, but the key point here is that you need to look at debt to understand the P/E ratio in context.
How Does MOQ's Debt Impact Its P/E Ratio?
MOQ has net cash of AU$741k. That should lead to a higher P/E than if it did have debt, because its strong balance sheets gives it more options.
The Verdict On MOQ's P/E Ratio
MOQ's P/E is 36.4 which is above average (14.7) in its market. Falling earnings per share is probably keeping traditional value investors away, but the healthy balance sheet means the company retains the potential for future growth. If this growth fails to materialise, the current high P/E could prove to be temporary, as the share price falls. What we know for sure is that investors have become much more excited about MOQ recently, since they have pushed its P/E ratio from 26.4 to 36.4 over the last month. For those who prefer to invest with the flow of momentum, that might mean it's time to put the stock on a watchlist, or research it. But the contrarian may see it as a missed opportunity.
Investors have an opportunity when market expectations about a stock are wrong. If the reality for a company is better than it expects, you can make money by buying and holding for the long term. Although we don't have analyst forecasts you could get a better understanding of its growth by checking out this more detailed historical graph of earnings, revenue and cash flow.
But note: MOQ may not be the best stock to buy. So take a peek at this free list of interesting companies with strong recent earnings growth (and a P/E ratio below 20).
If you spot an error that warrants correction, please contact the editor at editorial-team@simplywallst.com. This article by Simply Wall St is general in nature. It does not constitute a recommendation to buy or sell any stock, and does not take account of your objectives, or your financial situation. Simply Wall St has no position in the stocks mentioned.
We aim to bring you long-term focused research analysis driven by fundamental data. Note that our analysis may not factor in the latest price-sensitive company announcements or qualitative material. Thank you for reading.
