A Rising Share Price Has Us Looking Closely At NETGEAR, Inc.'s (NASDAQ:NTGR) P/E Ratio

NETGEAR (NASDAQ:NTGR) shareholders are no doubt pleased to see that the share price has had a great month, posting a 32% gain, recovering from prior weakness. But shareholders may not all be feeling jubilant, since the share price is still down 26% in the last year.
All else being equal, a sharp share price increase should make a stock less attractive to potential investors. While the market sentiment towards a stock is very changeable, in the long run, the share price will tend to move in the same direction as earnings per share. So some would prefer to hold off buying when there is a lot of optimism towards a stock. One way to gauge market expectations of a stock is to look at its Price to Earnings Ratio (PE Ratio). A high P/E implies that investors have high expectations of what a company can achieve compared to a company with a low P/E ratio.
Check out our latest analysis for NETGEAR
How Does NETGEAR's P/E Ratio Compare To Its Peers?
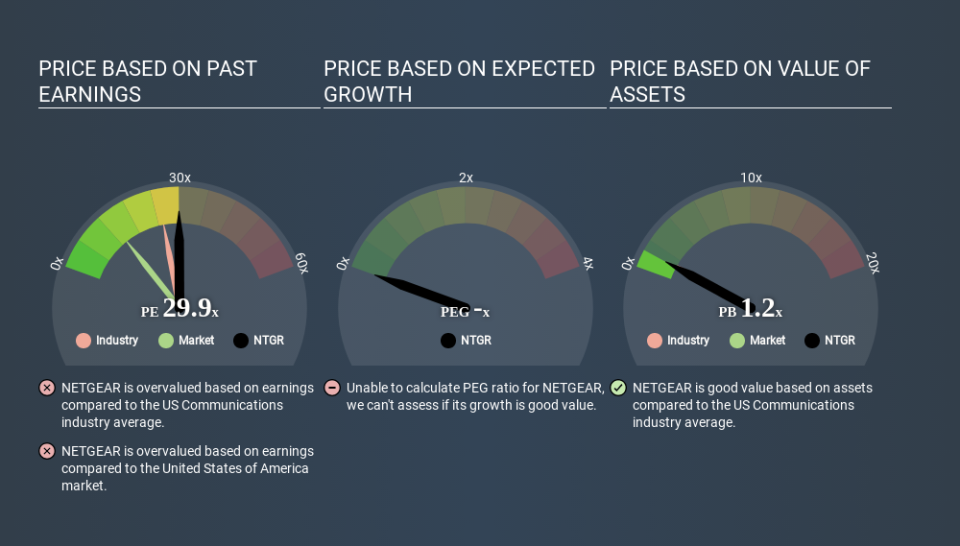
NETGEAR's P/E of 29.87 indicates some degree of optimism towards the stock. As you can see below, NETGEAR has a higher P/E than the average company (25.4) in the communications industry.
That means that the market expects NETGEAR will outperform other companies in its industry. The market is optimistic about the future, but that doesn't guarantee future growth. So investors should delve deeper. I like to check if company insiders have been buying or selling.
How Growth Rates Impact P/E Ratios
When earnings fall, the 'E' decreases, over time. That means unless the share price falls, the P/E will increase in a few years. Then, a higher P/E might scare off shareholders, pushing the share price down.
NETGEAR's earnings made like a rocket, taking off 52% last year. The sweetener is that the annual five year growth rate of 28% is also impressive. With that kind of growth rate we would generally expect a high P/E ratio. Regrettably, the longer term performance is poor, with EPS down -28% per year over 3 years.
Remember: P/E Ratios Don't Consider The Balance Sheet
One drawback of using a P/E ratio is that it considers market capitalization, but not the balance sheet. Thus, the metric does not reflect cash or debt held by the company. Hypothetically, a company could reduce its future P/E ratio by spending its cash (or taking on debt) to achieve higher earnings.
While growth expenditure doesn't always pay off, the point is that it is a good option to have; but one that the P/E ratio ignores.
So What Does NETGEAR's Balance Sheet Tell Us?
With net cash of US$196m, NETGEAR has a very strong balance sheet, which may be important for its business. Having said that, at 27% of its market capitalization the cash hoard would contribute towards a higher P/E ratio.
The Bottom Line On NETGEAR's P/E Ratio
NETGEAR's P/E is 29.9 which is above average (13.6) in its market. Its net cash position is the cherry on top of its superb EPS growth. To us, this is the sort of company that we would expect to carry an above average price tag (relative to earnings). What is very clear is that the market has become significantly more optimistic about NETGEAR over the last month, with the P/E ratio rising from 22.6 back then to 29.9 today. For those who prefer to invest with the flow of momentum, that might mean it's time to put the stock on a watchlist, or research it. But the contrarian may see it as a missed opportunity.
Investors have an opportunity when market expectations about a stock are wrong. If the reality for a company is better than it expects, you can make money by buying and holding for the long term. So this free report on the analyst consensus forecasts could help you make a master move on this stock.
Of course you might be able to find a better stock than NETGEAR. So you may wish to see this free collection of other companies that have grown earnings strongly.
If you spot an error that warrants correction, please contact the editor at editorial-team@simplywallst.com. This article by Simply Wall St is general in nature. It does not constitute a recommendation to buy or sell any stock, and does not take account of your objectives, or your financial situation. Simply Wall St has no position in the stocks mentioned.
We aim to bring you long-term focused research analysis driven by fundamental data. Note that our analysis may not factor in the latest price-sensitive company announcements or qualitative material. Thank you for reading.
