A Rising Share Price Has Us Looking Closely At Preformed Line Products Company's (NASDAQ:PLPC) P/E Ratio

It's really great to see that even after a strong run, Preformed Line Products (NASDAQ:PLPC) shares have been powering on, with a gain of 30% in the last thirty days. But that gain wasn't enough to make shareholders whole, as the share price is still down 4.2% in the last year.
All else being equal, a sharp share price increase should make a stock less attractive to potential investors. While the market sentiment towards a stock is very changeable, in the long run, the share price will tend to move in the same direction as earnings per share. So some would prefer to hold off buying when there is a lot of optimism towards a stock. One way to gauge market expectations of a stock is to look at its Price to Earnings Ratio (PE Ratio). A high P/E ratio means that investors have a high expectation about future growth, while a low P/E ratio means they have low expectations about future growth.
View our latest analysis for Preformed Line Products
Does Preformed Line Products Have A Relatively High Or Low P/E For Its Industry?
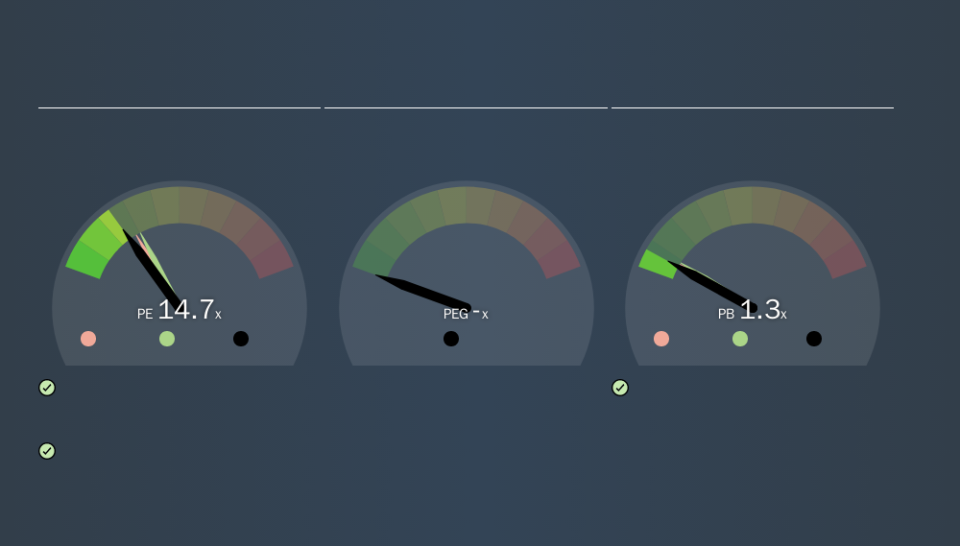
Preformed Line Products's P/E of 14.69 indicates relatively low sentiment towards the stock. We can see in the image below that the average P/E (17.0) for companies in the electrical industry is higher than Preformed Line Products's P/E.
Its relatively low P/E ratio indicates that Preformed Line Products shareholders think it will struggle to do as well as other companies in its industry classification. While current expectations are low, the stock could be undervalued if the situation is better than the market assumes. You should delve deeper. I like to check if company insiders have been buying or selling.
How Growth Rates Impact P/E Ratios
Earnings growth rates have a big influence on P/E ratios. When earnings grow, the 'E' increases, over time. That means unless the share price increases, the P/E will reduce in a few years. And as that P/E ratio drops, the company will look cheap, unless its share price increases.
Preformed Line Products's earnings per share grew by -4.5% in the last twelve months. And it has bolstered its earnings per share by 13% per year over the last five years.
Don't Forget: The P/E Does Not Account For Debt or Bank Deposits
It's important to note that the P/E ratio considers the market capitalization, not the enterprise value. Thus, the metric does not reflect cash or debt held by the company. In theory, a company can lower its future P/E ratio by using cash or debt to invest in growth.
Such spending might be good or bad, overall, but the key point here is that you need to look at debt to understand the P/E ratio in context.
So What Does Preformed Line Products's Balance Sheet Tell Us?
Preformed Line Products has net debt worth just 6.5% of its market capitalization. The market might award it a higher P/E ratio if it had net cash, but its unlikely this low level of net borrowing is having a big impact on the P/E multiple.
The Verdict On Preformed Line Products's P/E Ratio
Preformed Line Products has a P/E of 14.7. That's below the average in the US market, which is 18.2. EPS grew over the last twelve months, and debt levels are quite reasonable. The P/E ratio implies the market is cautious about longer term prospects. What is very clear is that the market has become more optimistic about Preformed Line Products over the last month, with the P/E ratio rising from 11.3 back then to 14.7 today. For those who prefer to invest with the flow of momentum, that might mean it's time to put the stock on a watchlist, or research it. But the contrarian may see it as a missed opportunity.
Investors should be looking to buy stocks that the market is wrong about. If it is underestimating a company, investors can make money by buying and holding the shares until the market corrects itself. Although we don't have analyst forecasts you could get a better understanding of its growth by checking out this more detailed historical graph of earnings, revenue and cash flow.
You might be able to find a better buy than Preformed Line Products. If you want a selection of possible winners, check out this free list of interesting companies that trade on a P/E below 20 (but have proven they can grow earnings).
We aim to bring you long-term focused research analysis driven by fundamental data. Note that our analysis may not factor in the latest price-sensitive company announcements or qualitative material.
If you spot an error that warrants correction, please contact the editor at editorial-team@simplywallst.com. This article by Simply Wall St is general in nature. It does not constitute a recommendation to buy or sell any stock, and does not take account of your objectives, or your financial situation. Simply Wall St has no position in the stocks mentioned. Thank you for reading.
