Are Robust Financials Driving The Recent Rally In 3D Energi Limited's (ASX:TDO) Stock?
Most readers would already be aware that 3D Energi's (ASX:TDO) stock increased significantly by 11% over the past week. Since the market usually pay for a company’s long-term fundamentals, we decided to study the company’s key performance indicators to see if they could be influencing the market. In this article, we decided to focus on 3D Energi's ROE.
Return on equity or ROE is an important factor to be considered by a shareholder because it tells them how effectively their capital is being reinvested. In other words, it is a profitability ratio which measures the rate of return on the capital provided by the company's shareholders.
Check out our latest analysis for 3D Energi
How Do You Calculate Return On Equity?
ROE can be calculated by using the formula:
Return on Equity = Net Profit (from continuing operations) ÷ Shareholders' Equity
So, based on the above formula, the ROE for 3D Energi is:
30% = AU$2.8m ÷ AU$9.2m (Based on the trailing twelve months to December 2023).
The 'return' is the income the business earned over the last year. One way to conceptualize this is that for each A$1 of shareholders' capital it has, the company made A$0.30 in profit.
Why Is ROE Important For Earnings Growth?
So far, we've learned that ROE is a measure of a company's profitability. Depending on how much of these profits the company reinvests or "retains", and how effectively it does so, we are then able to assess a company’s earnings growth potential. Generally speaking, other things being equal, firms with a high return on equity and profit retention, have a higher growth rate than firms that don’t share these attributes.
A Side By Side comparison of 3D Energi's Earnings Growth And 30% ROE
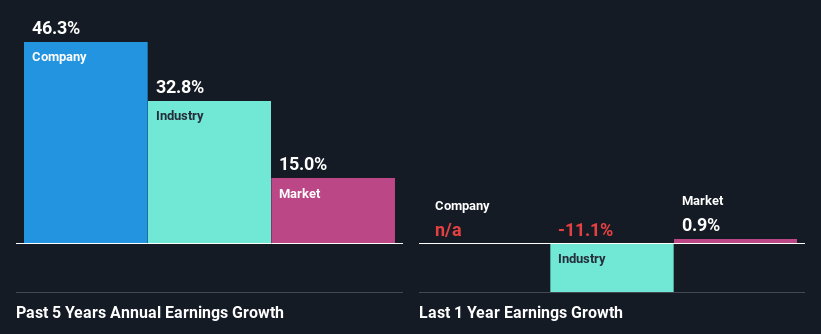
First thing first, we like that 3D Energi has an impressive ROE. Second, a comparison with the average ROE reported by the industry of 15% also doesn't go unnoticed by us. As a result, 3D Energi's exceptional 46% net income growth seen over the past five years, doesn't come as a surprise.
We then compared 3D Energi's net income growth with the industry and we're pleased to see that the company's growth figure is higher when compared with the industry which has a growth rate of 33% in the same 5-year period.
The basis for attaching value to a company is, to a great extent, tied to its earnings growth. The investor should try to establish if the expected growth or decline in earnings, whichever the case may be, is priced in. This then helps them determine if the stock is placed for a bright or bleak future. One good indicator of expected earnings growth is the P/E ratio which determines the price the market is willing to pay for a stock based on its earnings prospects. So, you may want to check if 3D Energi is trading on a high P/E or a low P/E, relative to its industry.
Is 3D Energi Efficiently Re-investing Its Profits?
3D Energi doesn't pay any dividend currently which essentially means that it has been reinvesting all of its profits into the business. This definitely contributes to the high earnings growth number that we discussed above.
Conclusion
On the whole, we feel that 3D Energi's performance has been quite good. In particular, it's great to see that the company is investing heavily into its business and along with a high rate of return, that has resulted in a sizeable growth in its earnings. If the company continues to grow its earnings the way it has, that could have a positive impact on its share price given how earnings per share influence long-term share prices. Not to forget, share price outcomes are also dependent on the potential risks a company may face. So it is important for investors to be aware of the risks involved in the business. You can see the 3 risks we have identified for 3D Energi by visiting our risks dashboard for free on our platform here.
Have feedback on this article? Concerned about the content? Get in touch with us directly. Alternatively, email editorial-team (at) simplywallst.com.
This article by Simply Wall St is general in nature. We provide commentary based on historical data and analyst forecasts only using an unbiased methodology and our articles are not intended to be financial advice. It does not constitute a recommendation to buy or sell any stock, and does not take account of your objectives, or your financial situation. We aim to bring you long-term focused analysis driven by fundamental data. Note that our analysis may not factor in the latest price-sensitive company announcements or qualitative material. Simply Wall St has no position in any stocks mentioned.
