Are Robust Financials Driving The Recent Rally In Casey's General Stores, Inc.'s (NASDAQ:CASY) Stock?
Casey's General Stores (NASDAQ:CASY) has had a great run on the share market with its stock up by a significant 15% over the last three months. Given the company's impressive performance, we decided to study its financial indicators more closely as a company's financial health over the long-term usually dictates market outcomes. In this article, we decided to focus on Casey's General Stores' ROE.
ROE or return on equity is a useful tool to assess how effectively a company can generate returns on the investment it received from its shareholders. In other words, it is a profitability ratio which measures the rate of return on the capital provided by the company's shareholders.
Check out our latest analysis for Casey's General Stores
How To Calculate Return On Equity?
The formula for ROE is:
Return on Equity = Net Profit (from continuing operations) ÷ Shareholders' Equity
So, based on the above formula, the ROE for Casey's General Stores is:
16% = US$471m ÷ US$2.9b (Based on the trailing twelve months to January 2024).
The 'return' is the amount earned after tax over the last twelve months. That means that for every $1 worth of shareholders' equity, the company generated $0.16 in profit.
What Has ROE Got To Do With Earnings Growth?
Thus far, we have learned that ROE measures how efficiently a company is generating its profits. Depending on how much of these profits the company reinvests or "retains", and how effectively it does so, we are then able to assess a company’s earnings growth potential. Assuming everything else remains unchanged, the higher the ROE and profit retention, the higher the growth rate of a company compared to companies that don't necessarily bear these characteristics.
Casey's General Stores' Earnings Growth And 16% ROE
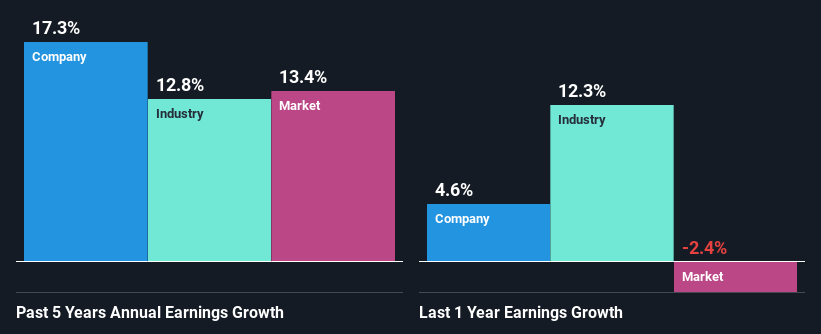
To begin with, Casey's General Stores seems to have a respectable ROE. And on comparing with the industry, we found that the the average industry ROE is similar at 14%. Consequently, this likely laid the ground for the decent growth of 17% seen over the past five years by Casey's General Stores.
Next, on comparing with the industry net income growth, we found that Casey's General Stores' growth is quite high when compared to the industry average growth of 13% in the same period, which is great to see.
The basis for attaching value to a company is, to a great extent, tied to its earnings growth. It’s important for an investor to know whether the market has priced in the company's expected earnings growth (or decline). This then helps them determine if the stock is placed for a bright or bleak future. What is CASY worth today? The intrinsic value infographic in our free research report helps visualize whether CASY is currently mispriced by the market.
Is Casey's General Stores Using Its Retained Earnings Effectively?
Casey's General Stores has a low three-year median payout ratio of 14%, meaning that the company retains the remaining 86% of its profits. This suggests that the management is reinvesting most of the profits to grow the business.
Additionally, Casey's General Stores has paid dividends over a period of at least ten years which means that the company is pretty serious about sharing its profits with shareholders. Our latest analyst data shows that the future payout ratio of the company over the next three years is expected to be approximately 13%. Accordingly, forecasts suggest that Casey's General Stores' future ROE will be 15% which is again, similar to the current ROE.
Summary
Overall, we are quite pleased with Casey's General Stores' performance. In particular, it's great to see that the company is investing heavily into its business and along with a high rate of return, that has resulted in a sizeable growth in its earnings. With that said, the latest industry analyst forecasts reveal that the company's earnings growth is expected to slow down. To know more about the latest analysts predictions for the company, check out this visualization of analyst forecasts for the company.
Have feedback on this article? Concerned about the content? Get in touch with us directly. Alternatively, email editorial-team (at) simplywallst.com.
This article by Simply Wall St is general in nature. We provide commentary based on historical data and analyst forecasts only using an unbiased methodology and our articles are not intended to be financial advice. It does not constitute a recommendation to buy or sell any stock, and does not take account of your objectives, or your financial situation. We aim to bring you long-term focused analysis driven by fundamental data. Note that our analysis may not factor in the latest price-sensitive company announcements or qualitative material. Simply Wall St has no position in any stocks mentioned.
