Are Robust Financials Driving The Recent Rally In Climb Global Solutions, Inc.'s (NASDAQ:CLMB) Stock?
Climb Global Solutions (NASDAQ:CLMB) has had a great run on the share market with its stock up by a significant 14% over the last three months. Given the company's impressive performance, we decided to study its financial indicators more closely as a company's financial health over the long-term usually dictates market outcomes. In this article, we decided to focus on Climb Global Solutions' ROE.
Return on equity or ROE is a key measure used to assess how efficiently a company's management is utilizing the company's capital. In simpler terms, it measures the profitability of a company in relation to shareholder's equity.
See our latest analysis for Climb Global Solutions
How Is ROE Calculated?
The formula for ROE is:
Return on Equity = Net Profit (from continuing operations) ÷ Shareholders' Equity
So, based on the above formula, the ROE for Climb Global Solutions is:
18% = US$12m ÷ US$68m (Based on the trailing twelve months to September 2023).
The 'return' is the income the business earned over the last year. One way to conceptualize this is that for each $1 of shareholders' capital it has, the company made $0.18 in profit.
What Is The Relationship Between ROE And Earnings Growth?
Thus far, we have learned that ROE measures how efficiently a company is generating its profits. We now need to evaluate how much profit the company reinvests or "retains" for future growth which then gives us an idea about the growth potential of the company. Generally speaking, other things being equal, firms with a high return on equity and profit retention, have a higher growth rate than firms that don’t share these attributes.
A Side By Side comparison of Climb Global Solutions' Earnings Growth And 18% ROE
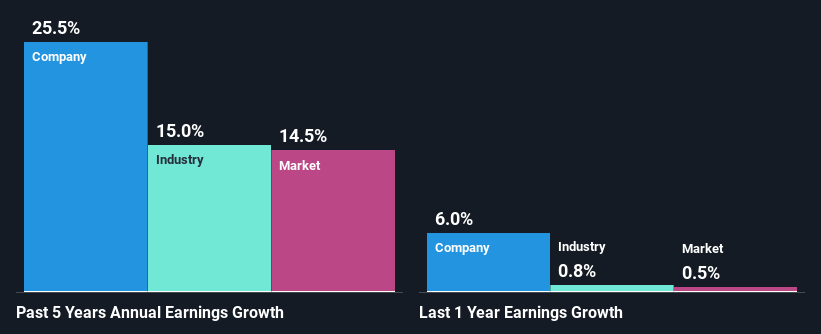
To begin with, Climb Global Solutions seems to have a respectable ROE. On comparing with the average industry ROE of 12% the company's ROE looks pretty remarkable. This probably laid the ground for Climb Global Solutions' significant 26% net income growth seen over the past five years. However, there could also be other causes behind this growth. For example, it is possible that the company's management has made some good strategic decisions, or that the company has a low payout ratio.
We then compared Climb Global Solutions' net income growth with the industry and we're pleased to see that the company's growth figure is higher when compared with the industry which has a growth rate of 15% in the same 5-year period.
The basis for attaching value to a company is, to a great extent, tied to its earnings growth. The investor should try to establish if the expected growth or decline in earnings, whichever the case may be, is priced in. Doing so will help them establish if the stock's future looks promising or ominous. One good indicator of expected earnings growth is the P/E ratio which determines the price the market is willing to pay for a stock based on its earnings prospects. So, you may want to check if Climb Global Solutions is trading on a high P/E or a low P/E, relative to its industry.
Is Climb Global Solutions Using Its Retained Earnings Effectively?
Climb Global Solutions' three-year median payout ratio is a pretty moderate 29%, meaning the company retains 71% of its income. This suggests that its dividend is well covered, and given the high growth we discussed above, it looks like Climb Global Solutions is reinvesting its earnings efficiently.
Moreover, Climb Global Solutions is determined to keep sharing its profits with shareholders which we infer from its long history of paying a dividend for at least ten years.
Summary
On the whole, we feel that Climb Global Solutions' performance has been quite good. Specifically, we like that the company is reinvesting a huge chunk of its profits at a high rate of return. This of course has caused the company to see substantial growth in its earnings. We also studied the latest analyst forecasts and found that the company's earnings growth is expected be similar to its current growth rate. Are these analysts expectations based on the broad expectations for the industry, or on the company's fundamentals? Click here to be taken to our analyst's forecasts page for the company.
Have feedback on this article? Concerned about the content? Get in touch with us directly. Alternatively, email editorial-team (at) simplywallst.com.
This article by Simply Wall St is general in nature. We provide commentary based on historical data and analyst forecasts only using an unbiased methodology and our articles are not intended to be financial advice. It does not constitute a recommendation to buy or sell any stock, and does not take account of your objectives, or your financial situation. We aim to bring you long-term focused analysis driven by fundamental data. Note that our analysis may not factor in the latest price-sensitive company announcements or qualitative material. Simply Wall St has no position in any stocks mentioned.
