Are Robust Financials Driving The Recent Rally In Texas Pacific Land Corporation's (NYSE:TPL) Stock?
Texas Pacific Land (NYSE:TPL) has had a great run on the share market with its stock up by a significant 31% over the last three months. Given the company's impressive performance, we decided to study its financial indicators more closely as a company's financial health over the long-term usually dictates market outcomes. In this article, we decided to focus on Texas Pacific Land's ROE.
ROE or return on equity is a useful tool to assess how effectively a company can generate returns on the investment it received from its shareholders. In simpler terms, it measures the profitability of a company in relation to shareholder's equity.
Check out our latest analysis for Texas Pacific Land
How Is ROE Calculated?
The formula for return on equity is:
Return on Equity = Net Profit (from continuing operations) ÷ Shareholders' Equity
So, based on the above formula, the ROE for Texas Pacific Land is:
59% = US$426m ÷ US$721m (Based on the trailing twelve months to September 2022).
The 'return' is the amount earned after tax over the last twelve months. That means that for every $1 worth of shareholders' equity, the company generated $0.59 in profit.
Why Is ROE Important For Earnings Growth?
Thus far, we have learned that ROE measures how efficiently a company is generating its profits. Depending on how much of these profits the company reinvests or "retains", and how effectively it does so, we are then able to assess a company’s earnings growth potential. Generally speaking, other things being equal, firms with a high return on equity and profit retention, have a higher growth rate than firms that don’t share these attributes.
Texas Pacific Land's Earnings Growth And 59% ROE
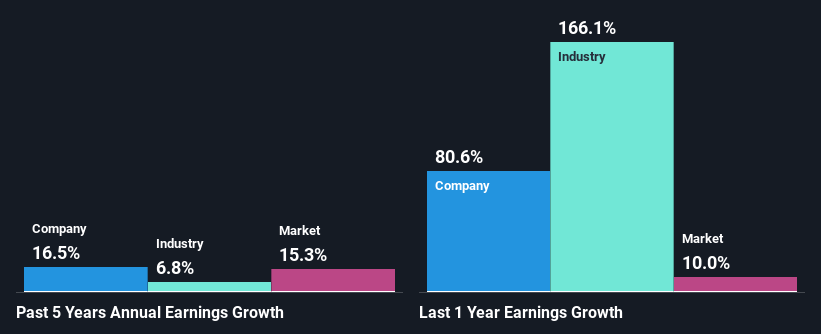
To begin with, Texas Pacific Land has a pretty high ROE which is interesting. Second, a comparison with the average ROE reported by the industry of 32% also doesn't go unnoticed by us. This probably laid the groundwork for Texas Pacific Land's moderate 16% net income growth seen over the past five years.
As a next step, we compared Texas Pacific Land's net income growth with the industry, and pleasingly, we found that the growth seen by the company is higher than the average industry growth of 6.8%.
Earnings growth is an important metric to consider when valuing a stock. The investor should try to establish if the expected growth or decline in earnings, whichever the case may be, is priced in. By doing so, they will have an idea if the stock is headed into clear blue waters or if swampy waters await. Is Texas Pacific Land fairly valued compared to other companies? These 3 valuation measures might help you decide.
Is Texas Pacific Land Making Efficient Use Of Its Profits?
Texas Pacific Land has a healthy combination of a moderate three-year median payout ratio of 27% (or a retention ratio of 73%) and a respectable amount of growth in earnings as we saw above, meaning that the company has been making efficient use of its profits.
Moreover, Texas Pacific Land is determined to keep sharing its profits with shareholders which we infer from its long history of paying a dividend for at least ten years. Upon studying the latest analysts' consensus data, we found that the company's future payout ratio is expected to drop to 14% over the next three years.
Summary
On the whole, we feel that Texas Pacific Land's performance has been quite good. In particular, it's great to see that the company is investing heavily into its business and along with a high rate of return, that has resulted in a sizeable growth in its earnings. The latest industry analyst forecasts show that the company is expected to maintain its current growth rate. To know more about the latest analysts predictions for the company, check out this visualization of analyst forecasts for the company.
Have feedback on this article? Concerned about the content? Get in touch with us directly. Alternatively, email editorial-team (at) simplywallst.com.
This article by Simply Wall St is general in nature. We provide commentary based on historical data and analyst forecasts only using an unbiased methodology and our articles are not intended to be financial advice. It does not constitute a recommendation to buy or sell any stock, and does not take account of your objectives, or your financial situation. We aim to bring you long-term focused analysis driven by fundamental data. Note that our analysis may not factor in the latest price-sensitive company announcements or qualitative material. Simply Wall St has no position in any stocks mentioned.
Join A Paid User Research Session
You’ll receive a US$30 Amazon Gift card for 1 hour of your time while helping us build better investing tools for the individual investors like yourself. Sign up here
