With An ROE Of 16.76%, Has Gran Colombia Gold Corp’s (TSE:GCM) Management Done Well?

This article is intended for those of you who are at the beginning of your investing journey and want to begin learning the link between company’s fundamentals and stock market performance.
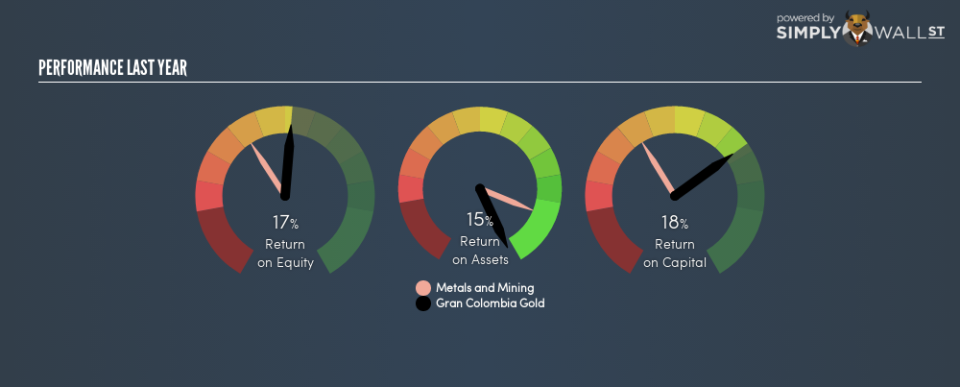
With an ROE of 16.76%, Gran Colombia Gold Corp (TSE:GCM) outpaced its own industry which delivered a less exciting 10.73% over the past year. On the surface, this looks fantastic since we know that GCM has made large profits from little equity capital; however, ROE doesn’t tell us if management have borrowed heavily to make this happen. We’ll take a closer look today at factors like financial leverage to determine whether GCM’s ROE is actually sustainable.
Check out our latest analysis for Gran Colombia Gold
Breaking down Return on Equity
Return on Equity (ROE) weighs Gran Colombia Gold’s profit against the level of its shareholders’ equity. An ROE of 16.76% implies CA$0.17 returned on every CA$1 invested. While a higher ROE is preferred in most cases, there are several other factors we should consider before drawing any conclusions.
Return on Equity = Net Profit ÷ Shareholders Equity
ROE is measured against cost of equity in order to determine the efficiency of Gran Colombia Gold’s equity capital deployed. Its cost of equity is 17.66%. This means Gran Colombia Gold’s returns actually do not cover its own cost of equity, with a discrepancy of -0.90%. This isn’t sustainable as it implies, very simply, that the company pays more for its capital than what it generates in return. ROE can be dissected into three distinct ratios: net profit margin, asset turnover, and financial leverage. This is called the Dupont Formula:
Dupont Formula
ROE = profit margin × asset turnover × financial leverage
ROE = (annual net profit ÷ sales) × (sales ÷ assets) × (assets ÷ shareholders’ equity)
ROE = annual net profit ÷ shareholders’ equity
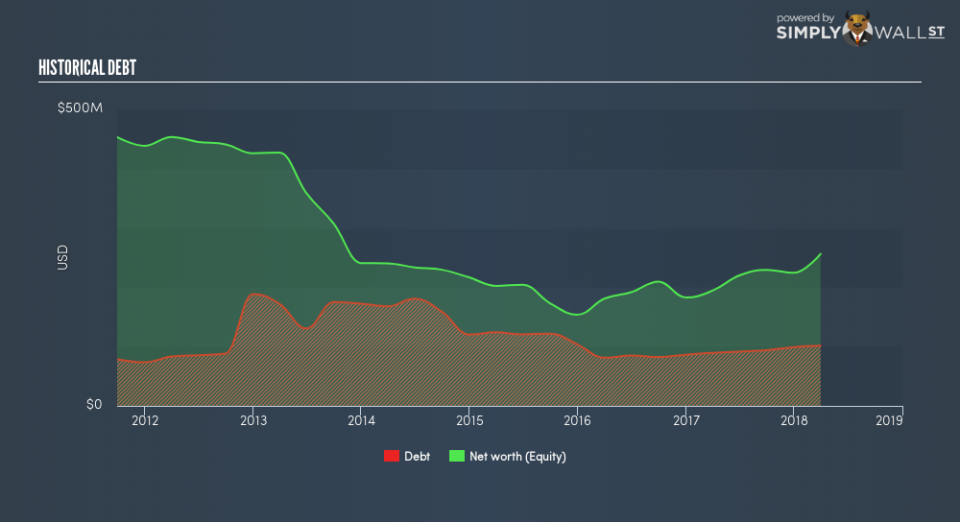
Essentially, profit margin shows how much money the company makes after paying for all its expenses. Asset turnover reveals how much revenue can be generated from Gran Colombia Gold’s asset base. The most interesting ratio, and reflective of sustainability of its ROE, is financial leverage. Since ROE can be inflated by excessive debt, we need to examine Gran Colombia Gold’s debt-to-equity level. At 39.56%, Gran Colombia Gold’s debt-to-equity ratio appears low and indicates the above-average ROE is generated from its capacity to increase profit without a large debt burden.
Next Steps:
ROE is one of many ratios which meaningfully dissects financial statements, which illustrates the quality of a company. Gran Colombia Gold’s ROE is impressive relative to the industry average, though its returns were not strong enough to cover its own cost of equity. ROE is not likely to be inflated by excessive debt funding, giving shareholders more conviction in the sustainability of industry-beating returns. Although ROE can be a useful metric, it is only a small part of diligent research.
For Gran Colombia Gold, I’ve put together three essential factors you should further research:
Financial Health: Does it have a healthy balance sheet? Take a look at our free balance sheet analysis with six simple checks on key factors like leverage and risk.
Valuation: What is Gran Colombia Gold worth today? Is the stock undervalued, even when its growth outlook is factored into its intrinsic value? The intrinsic value infographic in our free research report helps visualize whether Gran Colombia Gold is currently mispriced by the market.
Other High-Growth Alternatives : Are there other high-growth stocks you could be holding instead of Gran Colombia Gold? Explore our interactive list of stocks with large growth potential to get an idea of what else is out there you may be missing!
To help readers see past the short term volatility of the financial market, we aim to bring you a long-term focused research analysis purely driven by fundamental data. Note that our analysis does not factor in the latest price-sensitive company announcements.
The author is an independent contributor and at the time of publication had no position in the stocks mentioned. For errors that warrant correction please contact the editor at editorial-team@simplywallst.com.
