Rush Enterprises' (NASDAQ:RUSH.A) 27% CAGR outpaced the company's earnings growth over the same five-year period
The worst result, after buying shares in a company (assuming no leverage), would be if you lose all the money you put in. But on a lighter note, a good company can see its share price rise well over 100%. For instance, the price of Rush Enterprises, Inc. (NASDAQ:RUSH.A) stock is up an impressive 207% over the last five years. It's also good to see the share price up 24% over the last quarter. But this move may well have been assisted by the reasonably buoyant market (up 13% in 90 days).
Since it's been a strong week for Rush Enterprises shareholders, let's have a look at trend of the longer term fundamentals.
View our latest analysis for Rush Enterprises
While markets are a powerful pricing mechanism, share prices reflect investor sentiment, not just underlying business performance. By comparing earnings per share (EPS) and share price changes over time, we can get a feel for how investor attitudes to a company have morphed over time.
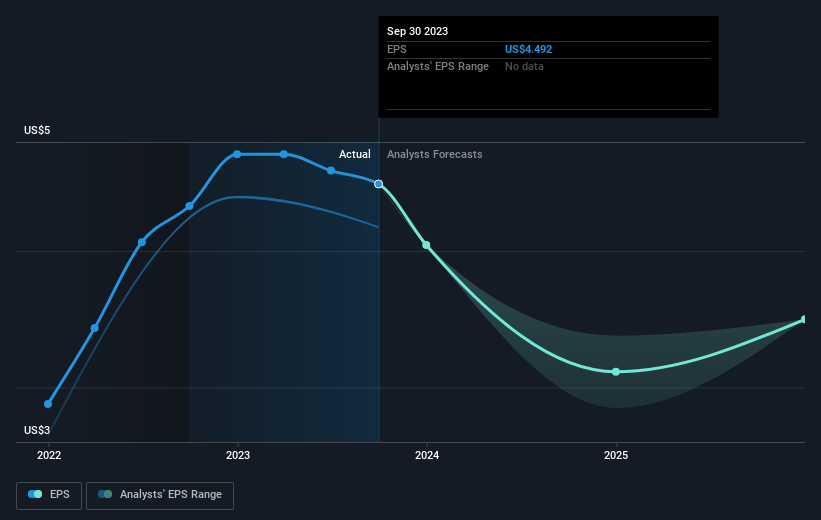
During five years of share price growth, Rush Enterprises achieved compound earnings per share (EPS) growth of 16% per year. This EPS growth is slower than the share price growth of 25% per year, over the same period. So it's fair to assume the market has a higher opinion of the business than it did five years ago. And that's hardly shocking given the track record of growth.
The graphic below depicts how EPS has changed over time (unveil the exact values by clicking on the image).
It is of course excellent to see how Rush Enterprises has grown profits over the years, but the future is more important for shareholders. If you are thinking of buying or selling Rush Enterprises stock, you should check out this FREE detailed report on its balance sheet.
What About Dividends?
When looking at investment returns, it is important to consider the difference between total shareholder return (TSR) and share price return. The TSR incorporates the value of any spin-offs or discounted capital raisings, along with any dividends, based on the assumption that the dividends are reinvested. It's fair to say that the TSR gives a more complete picture for stocks that pay a dividend. We note that for Rush Enterprises the TSR over the last 5 years was 230%, which is better than the share price return mentioned above. This is largely a result of its dividend payments!
A Different Perspective
It's good to see that Rush Enterprises has rewarded shareholders with a total shareholder return of 48% in the last twelve months. That's including the dividend. That's better than the annualised return of 27% over half a decade, implying that the company is doing better recently. Someone with an optimistic perspective could view the recent improvement in TSR as indicating that the business itself is getting better with time. It's always interesting to track share price performance over the longer term. But to understand Rush Enterprises better, we need to consider many other factors. For example, we've discovered 2 warning signs for Rush Enterprises (1 makes us a bit uncomfortable!) that you should be aware of before investing here.
Of course Rush Enterprises may not be the best stock to buy. So you may wish to see this free collection of growth stocks.
Please note, the market returns quoted in this article reflect the market weighted average returns of stocks that currently trade on American exchanges.
Have feedback on this article? Concerned about the content? Get in touch with us directly. Alternatively, email editorial-team (at) simplywallst.com.
This article by Simply Wall St is general in nature. We provide commentary based on historical data and analyst forecasts only using an unbiased methodology and our articles are not intended to be financial advice. It does not constitute a recommendation to buy or sell any stock, and does not take account of your objectives, or your financial situation. We aim to bring you long-term focused analysis driven by fundamental data. Note that our analysis may not factor in the latest price-sensitive company announcements or qualitative material. Simply Wall St has no position in any stocks mentioned.
