Ryder (R) Beats Q3 Earnings Estimates, Tweaks 2023 EPS View
Ryder System, Inc. R reported mixed third-quarter 2023 results, wherein earnings beat the Zacks Consensus Estimate but revenues missed.
Quarterly earnings (excluding 11 cents from non-recurring items) of $3.58 per share surpassed the Zacks Consensus Estimate of $3.38. However, the bottom line plunged 19.6% year over year, mainly reflecting weaker market conditions in used vehicle sales and rental.
Total revenues of $2,924 million lagged the Zacks Consensus Estimate of $3020.1 million. The top line decreased 3.7% year over year. Results were hurt by lower commercial rental revenues in Fleet Management Solutions.
Ryder System, Inc. Price, Consensus and EPS Surprise
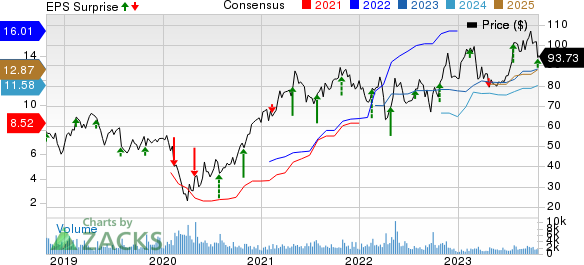
Ryder System, Inc. price-consensus-eps-surprise-chart | Ryder System, Inc. Quote
Segmental Results
Fleet Management Solutions: Total revenues of $1,487 million dipped 6% year over year. We estimated a marginal rise from third-quarter 2022 actuals. Operating revenues summed $1,266 million, down 3% year over year. Segmental revenues were hurt by the negative impact of operating revenues from the UK exit.
Supply-Chain Solutions: Total revenues of $1,194 million inched down 1% year over year. We suggested a 3.6% rise from third-quarter 2022 actuals. Operating revenues rose 9% year over year to $909 million on the back of strong revenue growth in all industry verticals primarily due to new business and increased pricing.
Dedicated Transportation Solutions: Total revenues reached $448 million, down 1% from the year-ago quarter. We projected a 1.7% gain from third-quarter 2022 actuals. Operating revenues climbed 3% to $325 million. The uptick was driven by inflationary cost recovery.
Liquidity
Ryder exited the third quarter with cash and cash equivalents of $159 million compared with $267 million at the end of December 2022. R’s total debt (including the current portion) was $6,621 million at third-quarter end compared with $6,352 million at the end of December 2022.
Q4 & 2023 Outlook
For fourth-quarter 2023, Ryder expects adjusted earnings per share in the range of $2.60-$2.85. The Zacks Consensus Estimate of $3.15 is above the guided range.
For 2023, management anticipates total revenues to decrease 2%. Operating revenues are forecast to increase 2%.
Adjusted EPS for the year is now estimated to be between $12.60 and $12.85 (prior view: $12.20 and $12.70). The Zacks Consensus Estimate of $11.82 is below the guided range.
Management now envisions free cash flow to be $100 million for 2023. Net cash from operating activities is still projected to be $2.5 billion. Adjusted ROE (return on equity) is still suggested in the 18-19% band (prior view: 17-19% range). Capital expenditure is still estimated to be $3.2 billion.
Zacks Rank
Currently, Ryder sports a Zacks Rank #1 (Strong Buy). You can see the complete list of today’s Zacks #1 Rank stocks here.
Q3 Performance of Other Players
United Airlines UAL reported third-quarter 2023 earnings per share (excluding 23 cents from non-recurring items) of $3.65, which outpaced the Zacks Consensus Estimate of $3.40 and improved 29.9% year over year.
Operating revenues of $14,484 million outpaced the Zacks Consensus Estimate of $14,441.8 million. The top line increased 12.5% year over year due to upbeat air-travel demand.
J.B. Hunt Transport Services, Inc.’s JBHT third-quarter 2023 earnings per share of $1.80 fell short of the Zacks Consensus Estimate of $1.85 and declined 30% year over year.
Total operating revenues of $3,163.8 million also lagged the Zacks Consensus Estimate of $3,224 million and tumbled 18% year over year.
Want the latest recommendations from Zacks Investment Research? Today, you can download 7 Best Stocks for the Next 30 Days. Click to get this free report
United Airlines Holdings Inc (UAL) : Free Stock Analysis Report
J.B. Hunt Transport Services, Inc. (JBHT) : Free Stock Analysis Report
Ryder System, Inc. (R) : Free Stock Analysis Report
