Is Sabre (SABR) Too Good to Be True? A Comprehensive Analysis of a Potential Value Trap
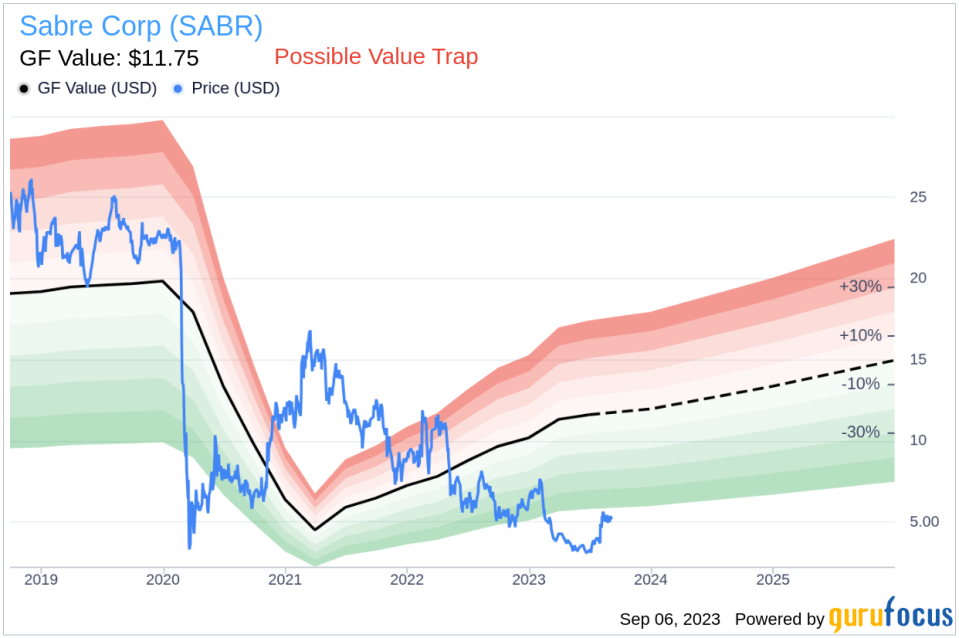
Value-focused investors are always on the hunt for stocks that are priced below their intrinsic value. One such stock that merits attention is Sabre Corp (NASDAQ:SABR). The stock, which is currently priced at 5.16, recorded a loss of 4% in a day and a 3-month increase of 54.63%. The stock's fair valuation is $11.75, as indicated by its GF Value.
Understanding GF Value
The GF Value represents the current intrinsic value of a stock derived from our exclusive method. The GF Value Line on our summary page gives an overview of the fair value that the stock should be traded at. It is calculated based on three factors: historical multiples (PE Ratio, PS Ratio, PB Ratio and Price-to-Free-Cash-Flow) that the stock has traded at, GuruFocus adjustment factor based on the company's past returns and growth, and future estimates of the business performance.
We believe the GF Value Line is the fair value that the stock should be traded at. The stock price will most likely fluctuate around the GF Value Line. If the stock price is significantly above the GF Value Line, it is overvalued and its future return is likely to be poor. On the other hand, if it is significantly below the GF Value Line, its future return will likely be higher.
Is Sabre a Hidden Gem or a Value Trap?
However, investors need to consider a more in-depth analysis before making an investment decision. Despite its seemingly attractive valuation, certain risk factors associated with Sabre should not be ignored. These risks are primarily reflected through its low Altman Z-score of -0.3, and the company's revenues and earnings have been on a downward trend over the past five years, which raises a crucial question: Is Sabre a hidden gem or a value trap?
These indicators suggest that Sabre, despite its apparent undervaluation, might be a potential value trap. This complexity underlines the importance of thorough due diligence in investment decision-making.
Understanding the Altman Z-Score
Before delving into the details, let's understand what the Altman Z-score entails. Invented by New York University Professor Edward I. Altman in 1968, the Z-Score is a financial model that predicts the probability of a company entering bankruptcy within a two-year time frame. The Altman Z-Score combines five different financial ratios, each weighted to create a final score. A score below 1.8 suggests a high likelihood of financial distress, while a score above 3 indicates a low risk.
A Snapshot of Sabre Corp (NASDAQ:SABR)
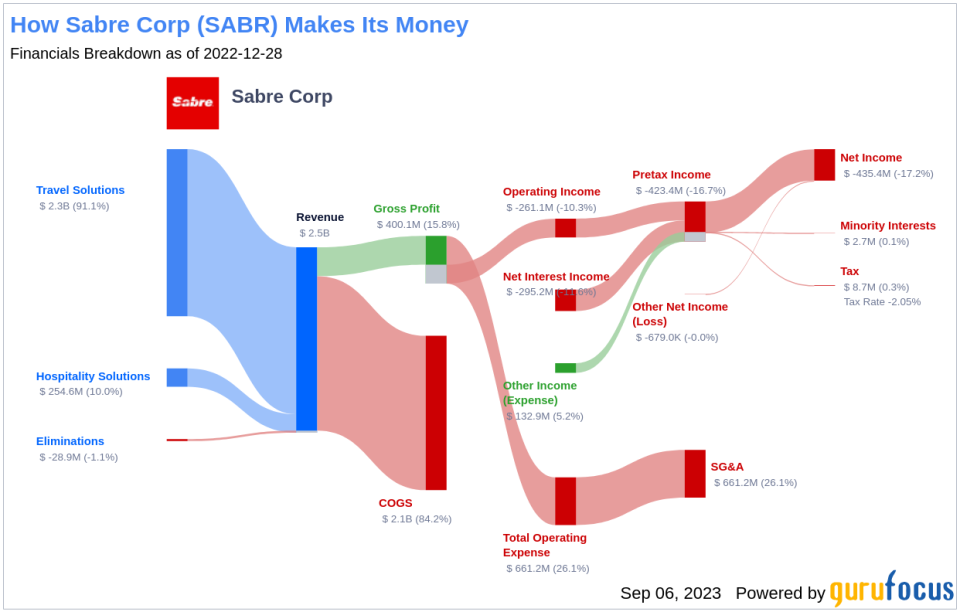
Sabre holds the number-two share of global distribution system for air bookings. The travel solutions segment represented 91% of total 2022 revenue, split between distribution (70% of segment sales) and airline IT solutions (30%) revenue. The company also has a growing hotel IT solutions division (10% of revenue). Transaction fees, which are mostly tied to volume and not price, account for the bulk of sales and profits.
Sabre's Low Altman Z-Score: A Breakdown of Key Drivers
A dissection of Sabre's Altman Z-score reveals Sabre's financial health may be weak, suggesting possible financial distress:
The Retained Earnings to Total Assets ratio provides insights into a company's capability to reinvest its profits or manage debt. Evaluating Sabre's historical data, 2021: -0.47; 2022: -0.62; 2023: -0.76, we observe a declining trend in this ratio. This downward movement indicates Sabre's diminishing ability to reinvest in its business or effectively manage its debt. Consequently, it exerts a negative impact on its Z-Score.
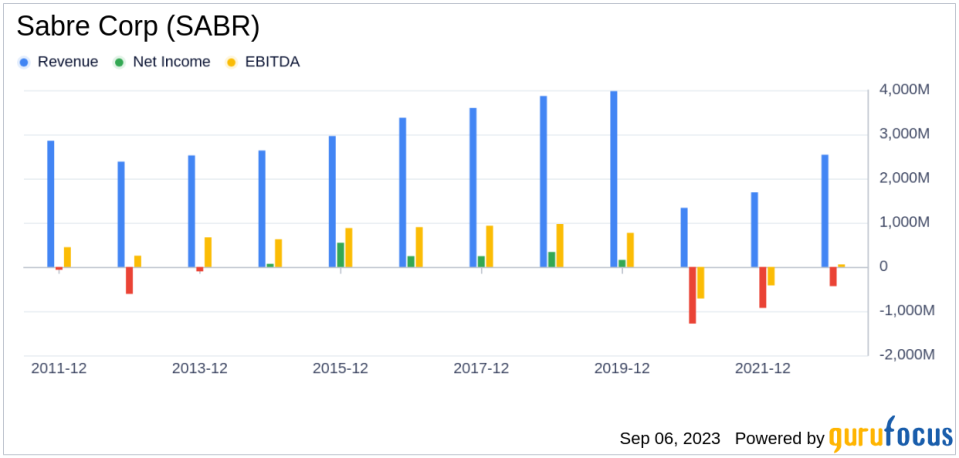
The Bearish Signs: Declining Revenues and Earnings
One of the telltale indicators of a company's potential trouble is a sustained decline in revenues. In the case of Sabre, both the revenue per share (evident from the last five years' TTM data: 2019: 14.21; 2020: 9.69; 2021: 4.28; 2022: 6.36; 2023: 8.42; ) and the 5-year revenue growth rate (-17.2%) have been on a consistent downward trajectory. This pattern may point to underlying challenges such as diminishing demand for Sabre's products, or escalating competition in its market sector. Either scenario can pose serious risks to the company's future performance, warranting a thorough analysis by investors.
The Red Flag: Sluggish Earnings Growth
Despite its low price-to-fair-value ratio, Sabre's falling revenues and earnings cast a long shadow over its investment attractiveness. A low price relative to intrinsic value can indeed suggest an investment opportunity, but only if the company's fundamentals are sound or improving. In Sabre's case, the declining revenues, EBITDA, and earnings growth suggest that the company's issues may be more than just cyclical fluctuations.
Without a clear turnaround strategy, there's a risk that the company's performance could continue to deteriorate, leading to further price declines. In such a scenario, the low price-to-GF-Value ratio may be more indicative of a value trap than a value opportunity.
Conclusion
While Sabre's current price may seem attractive, its low Altman Z-Score and declining revenues and earnings suggest that it could be a value trap. Investors need to exercise caution and conduct thorough due diligence before making an investment decision. As always, the key to successful investing lies not in chasing apparent bargains, but in understanding the underlying fundamentals of the companies in which we invest.
GuruFocus Premium members can find stocks with high Altman Z-Score using the following Screener: Walter Schloss Screen .Investors can find stocks with good revenue and earnings growth using GuruFocus' Peter Lynch Growth with Low Valuation Screener.
This article first appeared on GuruFocus.
