Sage Group (The) PLC's Dividend Analysis
Assessing the Sustainability and Growth of Sage Group (The) PLC's Dividend
Sage Group (The) PLC (SGPYY) recently announced a dividend of $0.65 per share, payable on 2024-02-23, with the ex-dividend date set for 2024-01-11. As investors look forward to this upcoming payment, the spotlight also shines on the company's dividend history, yield, and growth rates. Using the data from GuruFocus, let's look into Sage Group (The) PLC's dividend performance and assess its sustainability.
What Does Sage Group (The) PLC Do?
This Powerful Chart Made Peter Lynch 29% A Year For 13 Years
How to calculate the intrinsic value of a stock?
The Sage Group is a U.K.-based provider of accounting and enterprise resource planning, or ERP, software, predominantly to customers in the U.S. and Europe. The company was founded in 1981 and historically sold on-premises software products with perpetual software licenses. However, the company is transitioning toward cloud connected and cloud native products, sold via software-as-a-service, or SaaS, contracts. Sage's main cloud native products include Sage Accounting, for small businesses, and Sage Intacct, which Sage acquired in 2017, for midsize businesses.
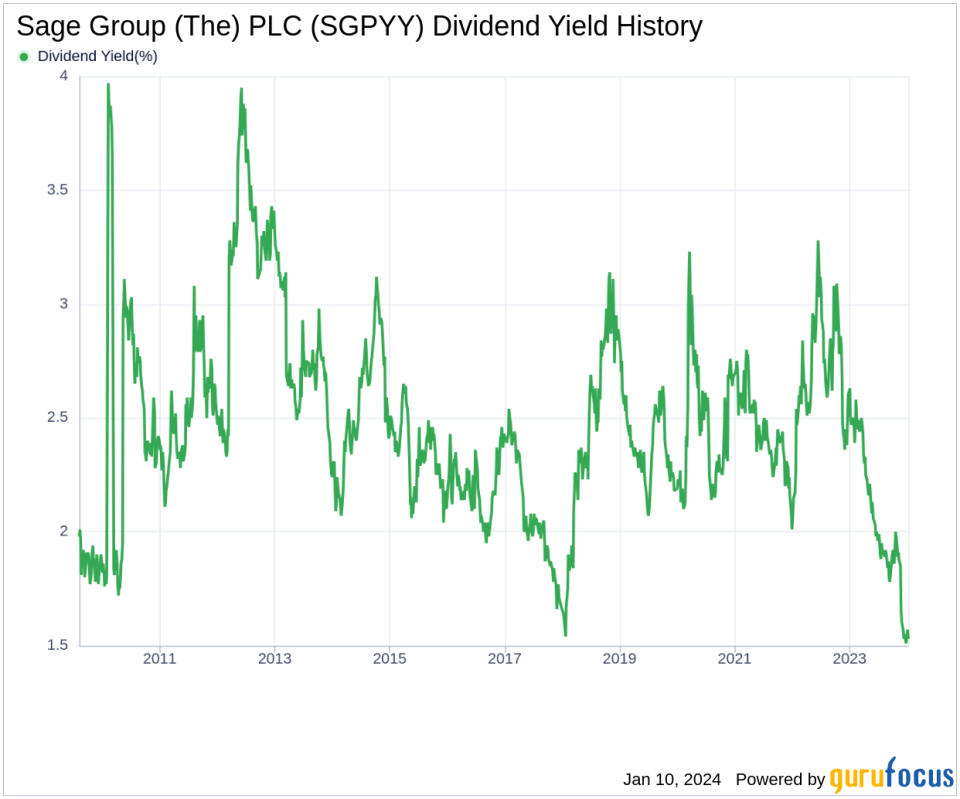
A Glimpse at Sage Group (The) PLC's Dividend History
Sage Group (The) PLC has maintained a consistent dividend payment record since 2005. Dividends are currently distributed on a bi-annually basis. Sage Group (The) PLC has increased its dividend each year since 2013. The stock is thus listed as a dividend achiever, an honor that is given to companies that have increased their dividend each year for at least the past 11 years. Below is a chart showing annual Dividends Per Share for tracking historical trends.
Breaking Down Sage Group (The) PLC's Dividend Yield and Growth
As of today, Sage Group (The) PLC currently has a 12-month trailing dividend yield of 1.55% and a 12-month forward dividend yield of 1.65%. This suggests an expectation of increased dividend payments over the next 12 months. Sage Group (The) PLC's dividend yield of 1.55% is near a 10-year low and underperforms than 51.6% of global competitors in the Software industry, suggesting that the company's dividend yield may not be a compelling proposition for income investors.
Over the past three years, Sage Group (The) PLC's annual dividend growth rate was 3.00%. Extended to a five-year horizon, this rate increased to 3.10% per year. And over the past decade, Sage Group (The) PLC's annual dividends per share growth rate stands at 5.60%. Based on Sage Group (The) PLC's dividend yield and five-year growth rate, the 5-year yield on cost of Sage Group (The) PLC stock as of today is approximately 1.81%.
The Sustainability Question: Payout Ratio and Profitability
To assess the sustainability of the dividend, one needs to evaluate the company's payout ratio. The dividend payout ratio provides insights into the portion of earnings the company distributes as dividends. A lower ratio suggests that the company retains a significant part of its earnings, thereby ensuring the availability of funds for future growth and unexpected downturns. As of 2023-09-30, Sage Group (The) PLC's dividend payout ratio is 0.91, which may suggest that the company's dividend may not be sustainable.
Sage Group (The) PLC's profitability rank, offers an understanding of the company's earnings prowess relative to its peers. GuruFocus ranks Sage Group (The) PLC's profitability 7 out of 10 as of 2023-09-30, suggesting good profitability prospects. The company has reported positive net income for each year over the past decade, further solidifying its high profitability.
Growth Metrics: The Future Outlook
To ensure the sustainability of dividends, a company must have robust growth metrics. Sage Group (The) PLC's growth rank of 7 out of 10 suggests that the company's growth trajectory is good relative to its competitors.
Revenue is the lifeblood of any company, and Sage Group (The) PLC's revenue per share, combined with the 3-year revenue growth rate, indicates a strong revenue model. Sage Group (The) PLC's revenue has increased by approximately 6.80% per year on average, a rate that underperforms than approximately 53.73% of global competitors.
The company's 3-year EPS growth rate showcases its capability to grow its earnings, a critical component for sustaining dividends in the long run. During the past three years, Sage Group (The) PLC's earnings increased by approximately 5.30% per year on average, a rate that underperforms than approximately 56.61% of global competitors.
Lastly, the company's 5-year EBITDA growth rate of -1.60%, which underperforms than approximately 76.48% of global competitors.
Engaging Conclusion: Sage Group (The) PLC's Dividend Outlook
When considering Sage Group (The) PLC's dividend payments, growth rate, payout ratio, profitability, and growth metrics, investors are presented with a mixed picture. While the company has a commendable history of dividend increases and a strong profitability rank, the sustainability of its dividend in light of the payout ratio and the mixed growth metrics poses questions for the future. Investors should weigh these factors against their investment goals and risk tolerance. Will Sage Group (The) PLC continue its dividend growth trajectory, and can it overcome the growth challenges it faces? These are questions value investors must ponder as they assess the company's potential for long-term income generation.
GuruFocus Premium users can screen for high-dividend yield stocks using the High Dividend Yield Screener.
This article, generated by GuruFocus, is designed to provide general insights and is not tailored financial advice. Our commentary is rooted in historical data and analyst projections, utilizing an impartial methodology, and is not intended to serve as specific investment guidance. It does not formulate a recommendation to purchase or divest any stock and does not consider individual investment objectives or financial circumstances. Our objective is to deliver long-term, fundamental data-driven analysis. Be aware that our analysis might not incorporate the most recent, price-sensitive company announcements or qualitative information. GuruFocus holds no position in the stocks mentioned herein.
This article first appeared on GuruFocus.
