Sally Beauty (SBH) Q1 Earnings Beat Estimates, Sales Dip Y/Y
Sally Beauty Holdings, Inc. SBH has reported mixed first-quarter fiscal 2024 results, with the top and bottom lines declining year over year. However, net sales and earnings beat the Zacks Consensus Estimate.
The company made significant progress in implementing strategic initiatives. In the fiscal first quarter, it prioritized customer-centric approaches, introduced innovations, provided education, and introduced services to its customers to drive top-line growth and enhance long-term profitability.
Sally Beauty Holdings, Inc. Price, Consensus and EPS Surprise
Sally Beauty Holdings, Inc. price-consensus-eps-surprise-chart | Sally Beauty Holdings, Inc. Quote
Q1 in Detail
Sally Beauty’s adjusted earnings were 39 cents per share, beating the Zacks Consensus Estimate of 36 cents. The metric declined from 52 cents in the year-ago quarter.
Consolidated net sales of $931.3 million beat the Zacks Consensus Estimate of $927 million. The metric declined 2.7% year over year, attributed primarily to the adverse effects of store closures that occurred in December 2022. Favorable currency rates increased net sales by 90 basis points.
Consolidated comparable sales fell 0.8% mainly on reduced traffic and inflationary pressures. This continued to impact consumer behavior at Sally Beauty. However, this decline was partially offset by expanded distribution, the introduction of brands and the improvement of salon demand trends at Beauty Systems Group.
The company operated 23 fewer stores than the year-ago quarter. At constant-currency rates, global e-commerce sales accounted for $91 million, representing 9.8% of the total consolidated net sales for the quarter.
Consolidated gross profit came in at $467.2 million, down 4.4% from $488.6 million in the year-ago quarter. The adjusted gross margin contracted 60 basis points to 50.2% mainly on the unfavorable shift in the sales mix between Sally Beauty (which has a higher margin) and Beauty Systems Group (which has a lower margin), as well as unfavorable fixed cost absorption. However, these factors were partially mitigated by cost reductions in distribution and freight expenses on improved supply-chain efficiencies.
Adjusted operating earnings were $73.9 million, down from $95.4 million in the year-ago quarter. The adjusted operating margin contracted from 10% to 7.9% in the fiscal first quarter.
Adjusted selling, general and administrative expenses were $393.3 million, up $2.7 million year over year. The upside was mainly due to higher labor costs, rent expenses and other costs associated with the company's strategic initiatives. As a percentage of sales, the metric stood at 42.2% compared with 40.8% in the prior year.
Adjusted EBITDA came at $107.1 million, representing a decrease of 14.9% from the previous year. Additionally, the adjusted EBITDA margin stood at 11.5%, reflecting a decrease of 160 basis points from the prior-year period.
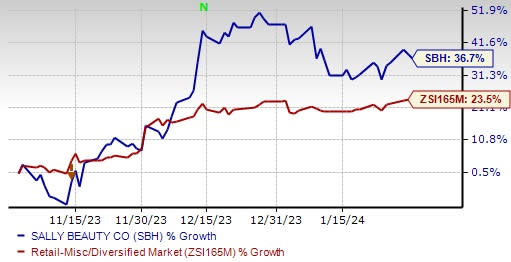
Image Source: Zacks Investment Research
Segmental Details
Sally Beauty Supply: Net sales in the segment fell 4.8% year over year to $523.2 million. Favorable foreign exchange had a positive impact of 160 bps on sales. The segment’s comparable sales fell 1.9%. Net store count at the end of the quarter was 3,143, down by three stores from the year-ago quarter’s level. Segmental e-commerce sales at cc stood at $35 million, contributing 6.7% to the segment’s net sales.
Beauty Systems Group: Net sales in the segment slightly increased 0.1% year over year to $408.1 million. The segment’s comparable sales increased 0.7%. The net store count at the end of the quarter was 1,332, down by 20 from the year-ago quarter. Total distributor sales consultants at the end of the quarter were 656 compared with 688 in the year-ago period. Segmental e-commerce sales at cc were $56 million, contributing 13.8% to the segment’s net sales.
Other Financial Aspects
SBH ended the fiscal first quarter with cash and cash equivalents of $121 million, long-term debt, including capital leases of $1,065.3 million, and total stockholders’ equity of $541.3 million.
In the fiscal first quarter, the company provided cash flow from operations of $51 million. Capital expenditure was $30.6 million for the period. Management expects capital expenditure of 100 million and an operating cash flow of at least $260 million in fiscal 2024. In the fiscal first quarter, the company repurchased 1.9 million shares as part of its share repurchase program.
FY24 Outlook
For fiscal 2024, management expects net sales and comparable sales to be almost flat year over year on gains from strategic initiatives. However, projected pressure on consumer spending is likely to be a hurdle. The gross margin is anticipated to be above 50%, with an adjusted operating margin of at least 9%.
The Zacks Rank #2 (Buy) company’s shares have gained 36.7% in the past three months compared with the industry’s 23.5% growth.
Other Retail Picks
A few other top-ranked stocks are Abercrombie & Fitch Co. ANF, Target Corporation TGT and The TJX Companies, Inc. TJX.
Abercrombie operates as a specialty retailer of premium, high-quality casual apparel. It currently sports a Zacks Rank #1 (Strong Buy). The company recorded an EPS surprise of 60.5% in the last reported quarter.
You can see the complete list of today’s Zacks #1 Rank stocks here.
The Zacks Consensus Estimate for Abercrombie’s current fiscal-year sales suggests growth of 15.1% from the year-ago reported number. ANF has a trailing four-quarter earnings surprise of 713%, on average.
Target has evolved from being a pure brick-and-mortar retailer to an omni-channel entity. The company carries a Zacks Rank #2 at present.
The Zacks Consensus Estimate for Target’s current fiscal-year earnings implies growth of 38.5% from the fiscal 2022 reported number. TGT has a trailing four-quarter average earnings surprise of 30.8%.
TJX Companies is a leading off-price retailer of apparel and home fashions in the United States and worldwide. It currently has a Zacks Rank #2.
The Zacks Consensus Estimate for TJX Companies’ current fiscal-year earnings and sales indicates growth of 20.6% and 8%, respectively, from the fiscal 2023 reported figures. TJX has a trailing four-quarter average earnings surprise of 6.3%.
Want the latest recommendations from Zacks Investment Research? Today, you can download 7 Best Stocks for the Next 30 Days. Click to get this free report
Target Corporation (TGT) : Free Stock Analysis Report
The TJX Companies, Inc. (TJX) : Free Stock Analysis Report
Abercrombie & Fitch Company (ANF) : Free Stock Analysis Report
Sally Beauty Holdings, Inc. (SBH) : Free Stock Analysis Report
