Sally Beauty's (SBH) Q3 Earnings Meet Estimates, Sales Down Y/Y
Sally Beauty Holdings, Inc. SBH reported dismal third-quarter fiscal 2023 results, with the top and the bottom line declining year over year. Net sales missed the Zacks Consensus Estimate while earnings met the same.
Q3 in Detail
Sally Beauty reported adjusted earnings of 49 cents per share, in line with the Zacks Consensus Estimate. The metric declined from 55 cents reported in the year-ago quarter.
Consolidated net sales of $931 million missed the Zacks Consensus Estimate of $947.7 million. The metric declined 3.2% year over year. Favorable currency rates increased net sales by 20 basis points.
Comparable sales inched up 0.6% on the back of solid sales recapture rates from the recent store optimization efforts. These were offset by the continuation of stylist demand trends witnessed in the past several quarters at Beauty Systems Group. The Zacks Consensus Estimate for comparable sales was pegged at an increase of 2.9%. The company operated 352 fewer stores compared with the year-ago quarter’s levels. At constant currency or cc, global e-commerce sales rose 3% to $83 million, reflecting 8.9% of consolidated net sales.
Sally Beauty Holdings, Inc. Price, Consensus and EPS Surprise
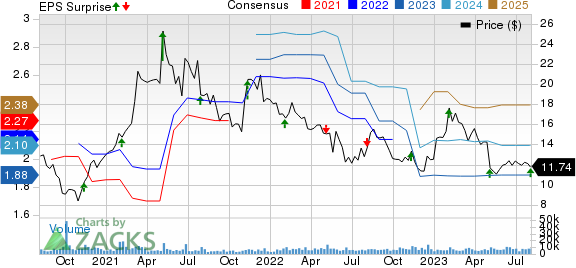
Sally Beauty Holdings, Inc. price-consensus-eps-surprise-chart | Sally Beauty Holdings, Inc. Quote
Consolidated gross profit came in at $474.7 million, down 3.2% from $490.2 million reported in the year-ago quarter. Adjusted gross margin was 50.9%, down 10 bps year over year. Operating earnings were $90.1 million, down from $99.2 million reported in the year-ago quarter. The operating margin contracted from 10.3% to 9.7% in the third quarter.
Selling, general and administrative (SG&A) expenses came in at $384.2 million, down $6.8 million compared with the year-ago quarter’s figure of $391 million. The downside was mainly caused by savings from its distribution center consolidation and store optimization plan, reduced advertising expenses and cost control. These factors were somewhat offset by increased labor and accrued bonus costs. As a percentage of sales, SG&A expenses stood at 41.3%, up from 40.7% reported in the year-ago quarter.
Segment Details
Sally Beauty Supply: Net sales in the segment fell 3% to $534.9 million. Favorable foreign exchange had a positive impact of 70 bps on sales. The segment’s comparable sales grew 3%. The Zacks Consensus Estimate for segment comparable sales was pegged at an increase of 3.53%. Net store count at the end of the quarter was 3,141, lower by 327 stores from the year-ago quarter’s level. Segment e-commerce sales at cc decreased 5% to $32 million, contributing 5.9% to the segment’s net sales.
Beauty Systems Group: Net sales in the segment went down 3.3% to $396.1 million. Unfavorable foreign exchange had a negative impact of 40 bps on sales. The segment’s comparable sales fell 2.4%. The Zacks Consensus Estimate for segment comparable sales was pegged at an increase of 2%. Net store count at the end of the quarter was 1,336, down by 25 stores from the year-ago quarter’s levels. Total distributor sales consultants at the end of the quarter were 650 compared with 700 in the year-ago period. Segment e-commerce sales at cc rose 8% to $51 million, contributing 13% to the segment’s net sales.
Other Aspects
The Zacks Rank #3 (Hold) company ended the reported quarter with cash and cash equivalents of $74.3 million, long-term debt, including capital leases of $1,064.9 million and total stockholders’ equity of $487.7 million. During the third quarter, the company provided cash flow from operations of $53.1 million. Capital expenditures came in at $21.6 million during this time.
Sally Beauty launched Happy Beauty Co., a different retail store concept that brings an engaging beauty experience of great value to the market. Every item is priced under $10 for Cosmetics & Facial Care, Bath & Body, Nails and Hair categories.
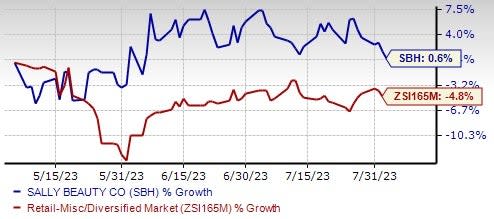
Image Source: Zacks Investment Research
Fiscal 2023 Outlook
For fiscal 2023, management expects comparable sales to grow by low single digits year over year. The upside can be attributed to growth in key categories, expanded Regis distribution, sales transfer from store closures and new strategic initiatives.
Net sales for fiscal 2023 are anticipated to decline by low-single digits, reflecting unfavorable impact owing to store closures net of expected sales recapture rates. The gross margin is projected to remain over 50%.
Management is revising its fiscal 2023 adjusted operating margin guidance to the higher end of the original view. The metric is likely to be 9-9.4% compared with 8.5-9.5% projected earlier.
SBH’s shares have increased 0.6% in the past three months against the industry’s 4.8% decline.
Some Top-Ranked Retails Bets
Abercrombie & Fitch ANF, a specialty retailer, currently sports a Zacks Rank #1 (Strong Buy). ANF has a trailing four-quarter earnings surprise of 480.6%, on average. You can see the complete list of today’s Zacks #1 Rank stocks here.
The Zacks Consensus Estimate for Abercrombie & Fitch’s current fiscal-year EPS suggests a considerable increase from the year-ago reported number.
Ross Stores ROST, an off-price retailer, currently carries a Zacks Rank #2 (Buy). ROST has a trailing four-quarter earnings surprise of 11.5%, on average.
The Zacks Consensus Estimate for Ross Stores’ current fiscal-year earnings suggests growth of 12.6% from the year-ago reported figure.
Urban Outfitters URBN, which engages in the retail and wholesale of general consumer products, currently carries a Zacks Rank #2. URBN has a trailing four-quarter earnings surprise of 12.2% on average.
The Zacks Consensus Estimate for Urban Outfitters’ current fiscal-year earnings suggests growth of 60% from the year-ago reported number.
Want the latest recommendations from Zacks Investment Research? Today, you can download 7 Best Stocks for the Next 30 Days. Click to get this free report
Abercrombie & Fitch Company (ANF) : Free Stock Analysis Report
Ross Stores, Inc. (ROST) : Free Stock Analysis Report
Urban Outfitters, Inc. (URBN) : Free Stock Analysis Report
Sally Beauty Holdings, Inc. (SBH) : Free Stock Analysis Report
