Sanderson Design Group plc's (LON:SDG) Fundamentals Look Pretty Strong: Could The Market Be Wrong About The Stock?
With its stock down 15% over the past three months, it is easy to disregard Sanderson Design Group (LON:SDG). But if you pay close attention, you might find that its key financial indicators look quite decent, which could mean that the stock could potentially rise in the long-term given how markets usually reward more resilient long-term fundamentals. Specifically, we decided to study Sanderson Design Group's ROE in this article.
ROE or return on equity is a useful tool to assess how effectively a company can generate returns on the investment it received from its shareholders. Put another way, it reveals the company's success at turning shareholder investments into profits.
View our latest analysis for Sanderson Design Group
How Do You Calculate Return On Equity?
ROE can be calculated by using the formula:
Return on Equity = Net Profit (from continuing operations) ÷ Shareholders' Equity
So, based on the above formula, the ROE for Sanderson Design Group is:
12% = UK£8.5m ÷ UK£72m (Based on the trailing twelve months to July 2021).
The 'return' is the amount earned after tax over the last twelve months. So, this means that for every £1 of its shareholder's investments, the company generates a profit of £0.12.
What Is The Relationship Between ROE And Earnings Growth?
So far, we've learned that ROE is a measure of a company's profitability. We now need to evaluate how much profit the company reinvests or "retains" for future growth which then gives us an idea about the growth potential of the company. Generally speaking, other things being equal, firms with a high return on equity and profit retention, have a higher growth rate than firms that don’t share these attributes.
Sanderson Design Group's Earnings Growth And 12% ROE
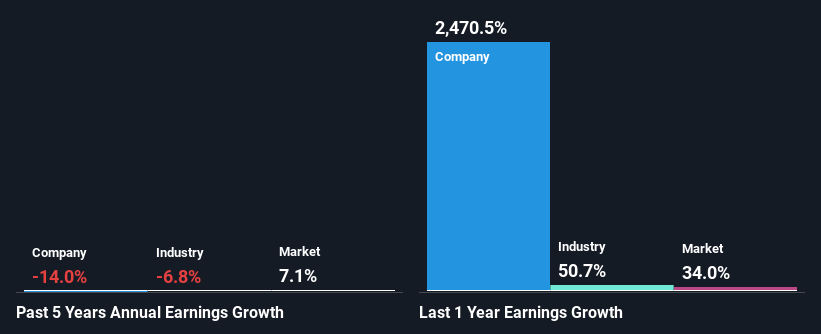
To start with, Sanderson Design Group's ROE looks acceptable. Even when compared to the industry average of 12% the company's ROE looks quite decent. For this reason, Sanderson Design Group's five year net income decline of 14% raises the question as to why the decent ROE didn't translate into growth. Based on this, we feel that there might be other reasons which haven't been discussed so far in this article that could be hampering the company's growth. Such as, the company pays out a huge portion of its earnings as dividends, or is faced with competitive pressures.
Furthermore, even when compared to the industry, which has been shrinking its earnings at a rate 6.8% in the same period, we found that Sanderson Design Group's performance is pretty disappointing, as it suggests that the company has been shrunk its earnings at a rate faster than the industry.
Earnings growth is an important metric to consider when valuing a stock. What investors need to determine next is if the expected earnings growth, or the lack of it, is already built into the share price. By doing so, they will have an idea if the stock is headed into clear blue waters or if swampy waters await. Is SDG fairly valued? This infographic on the company's intrinsic value has everything you need to know.
Is Sanderson Design Group Using Its Retained Earnings Effectively?
Sanderson Design Group's low three-year median payout ratio of 18% (implying that it retains the remaining 82% of its profits) comes as a surprise when you pair it with the shrinking earnings. The low payout should mean that the company is retaining most of its earnings and consequently, should see some growth. So there might be other factors at play here which could potentially be hampering growth. For instance, the business has faced some headwinds.
In addition, Sanderson Design Group has been paying dividends over a period of at least ten years suggesting that keeping up dividend payments is way more important to the management even if it comes at the cost of business growth. Our latest analyst data shows that the future payout ratio of the company is expected to rise to 30% over the next three years. However, the company's ROE is not expected to change by much despite the higher expected payout ratio.
Conclusion
In total, it does look like Sanderson Design Group has some positive aspects to its business. However, given the high ROE and high profit retention, we would expect the company to be delivering strong earnings growth, but that isn't the case here. This suggests that there might be some external threat to the business, that's hampering its growth. With that said, we studied current analyst estimates and discovered that analysts expect the company's earnings growth to improve slightly. Sure enough, this could bring some relief to shareholders. To know more about the latest analysts predictions for the company, check out this visualization of analyst forecasts for the company.
This article by Simply Wall St is general in nature. We provide commentary based on historical data and analyst forecasts only using an unbiased methodology and our articles are not intended to be financial advice. It does not constitute a recommendation to buy or sell any stock, and does not take account of your objectives, or your financial situation. We aim to bring you long-term focused analysis driven by fundamental data. Note that our analysis may not factor in the latest price-sensitive company announcements or qualitative material. Simply Wall St has no position in any stocks mentioned.
Have feedback on this article? Concerned about the content? Get in touch with us directly. Alternatively, email editorial-team (at) simplywallst.com.
