Can SandRidge Mississippian Trust II (NYSE:SDR) Continue To Outperform Its Industry?

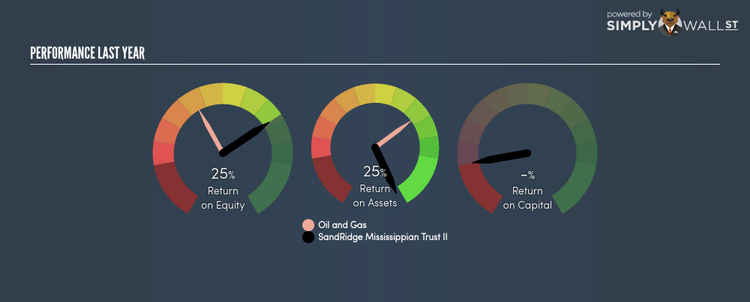
With an ROE of 25.01%, SandRidge Mississippian Trust II (NYSE:SDR) outpaced its own industry which delivered a less exciting 11.36% over the past year. While the impressive ratio tells us that SDR has made significant profits from little equity capital, ROE doesn’t tell us if SDR has borrowed debt to make this happen. Today, we’ll take a closer look at some factors like financial leverage to see how sustainable SDR’s ROE is. View our latest analysis for SandRidge Mississippian Trust II
What you must know about ROE
Firstly, Return on Equity, or ROE, is simply the percentage of last years’ earning against the book value of shareholders’ equity. For example, if the company invests $1 in the form of equity, it will generate $0.25 in earnings from this. While a higher ROE is preferred in most cases, there are several other factors we should consider before drawing any conclusions.
Return on Equity = Net Profit ÷ Shareholders Equity
ROE is measured against cost of equity in order to determine the efficiency of SandRidge Mississippian Trust II’s equity capital deployed. Its cost of equity is 10.18%. Given a positive discrepancy of 14.82% between return and cost, this indicates that SandRidge Mississippian Trust II pays less for its capital than what it generates in return, which is a sign of capital efficiency. ROE can be split up into three useful ratios: net profit margin, asset turnover, and financial leverage. This is called the Dupont Formula:
Dupont Formula
ROE = profit margin × asset turnover × financial leverage
ROE = (annual net profit ÷ sales) × (sales ÷ assets) × (assets ÷ shareholders’ equity)
ROE = annual net profit ÷ shareholders’ equity
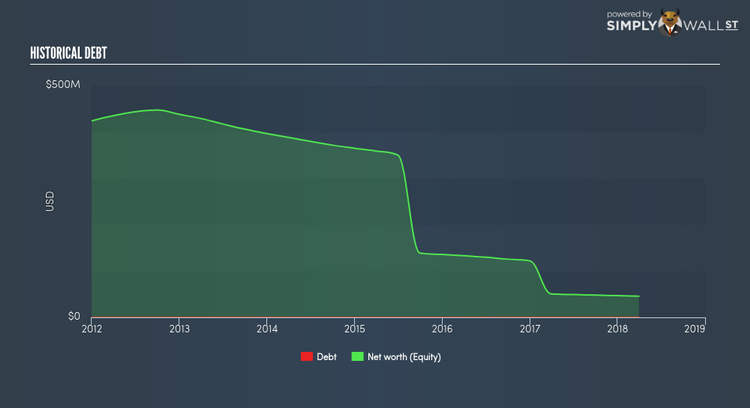
Basically, profit margin measures how much of revenue trickles down into earnings which illustrates how efficient the business is with its cost management. Asset turnover reveals how much revenue can be generated from SandRidge Mississippian Trust II’s asset base. The most interesting ratio, and reflective of sustainability of its ROE, is financial leverage. Since ROE can be inflated by excessive debt, we need to examine SandRidge Mississippian Trust II’s debt-to-equity level. Currently, SandRidge Mississippian Trust II has no debt which means its returns are driven purely by equity capital. Therefore, the level of financial leverage has no impact on ROE, and the ratio is a representative measure of the efficiency of all its capital employed firm-wide.
Next Steps:
ROE is a simple yet informative ratio, illustrating the various components that each measure the quality of the overall stock. SandRidge Mississippian Trust II’s ROE is impressive relative to the industry average and also covers its cost of equity. Its high ROE is not likely to be driven by high debt. Therefore, investors may have more confidence in the sustainability of this level of returns going forward. Although ROE can be a useful metric, it is only a small part of diligent research.
For SandRidge Mississippian Trust II, there are three key aspects you should look at:
Financial Health: Does it have a healthy balance sheet? Take a look at our free balance sheet analysis with six simple checks on key factors like leverage and risk.
Valuation: What is SandRidge Mississippian Trust II worth today? Is the stock undervalued, even when its growth outlook is factored into its intrinsic value? The intrinsic value infographic in our free research report helps visualize whether SandRidge Mississippian Trust II is currently mispriced by the market.
Other High-Growth Alternatives : Are there other high-growth stocks you could be holding instead of SandRidge Mississippian Trust II? Explore our interactive list of stocks with large growth potential to get an idea of what else is out there you may be missing!
To help readers see pass the short term volatility of the financial market, we aim to bring you a long-term focused research analysis purely driven by fundamental data. Note that our analysis does not factor in the latest price sensitive company announcements.
The author is an independent contributor and at the time of publication had no position in the stocks mentioned.
