Sapiens International Corporation N.V.'s (NASDAQ:SPNS) Stock Is Going Strong: Is the Market Following Fundamentals?
Sapiens International's (NASDAQ:SPNS) stock is up by a considerable 37% over the past three months. Given the company's impressive performance, we decided to study its financial indicators more closely as a company's financial health over the long-term usually dictates market outcomes. Specifically, we decided to study Sapiens International's ROE in this article.
Return on equity or ROE is an important factor to be considered by a shareholder because it tells them how effectively their capital is being reinvested. In short, ROE shows the profit each dollar generates with respect to its shareholder investments.
View our latest analysis for Sapiens International
How Do You Calculate Return On Equity?
The formula for return on equity is:
Return on Equity = Net Profit (from continuing operations) ÷ Shareholders' Equity
So, based on the above formula, the ROE for Sapiens International is:
13% = US$53m ÷ US$418m (Based on the trailing twelve months to March 2023).
The 'return' is the yearly profit. One way to conceptualize this is that for each $1 of shareholders' capital it has, the company made $0.13 in profit.
Why Is ROE Important For Earnings Growth?
So far, we've learned that ROE is a measure of a company's profitability. Depending on how much of these profits the company reinvests or "retains", and how effectively it does so, we are then able to assess a company’s earnings growth potential. Generally speaking, other things being equal, firms with a high return on equity and profit retention, have a higher growth rate than firms that don’t share these attributes.
Sapiens International's Earnings Growth And 13% ROE
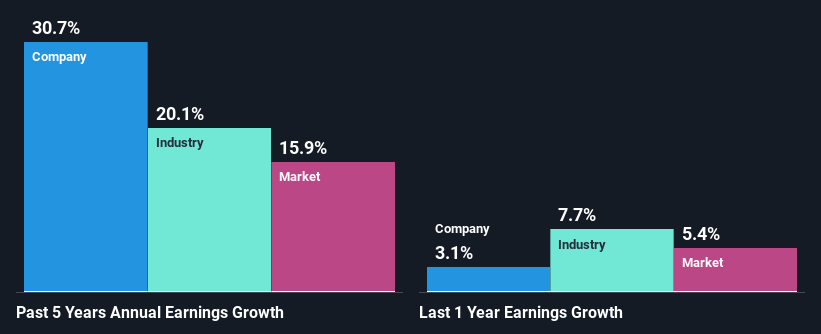
At first glance, Sapiens International seems to have a decent ROE. And on comparing with the industry, we found that the the average industry ROE is similar at 11%. This certainly adds some context to Sapiens International's exceptional 31% net income growth seen over the past five years. We reckon that there could also be other factors at play here. Such as - high earnings retention or an efficient management in place.
Next, on comparing with the industry net income growth, we found that Sapiens International's growth is quite high when compared to the industry average growth of 20% in the same period, which is great to see.
The basis for attaching value to a company is, to a great extent, tied to its earnings growth. It’s important for an investor to know whether the market has priced in the company's expected earnings growth (or decline). This then helps them determine if the stock is placed for a bright or bleak future. Is Sapiens International fairly valued compared to other companies? These 3 valuation measures might help you decide.
Is Sapiens International Making Efficient Use Of Its Profits?
Sapiens International's significant three-year median payout ratio of 50% (where it is retaining only 50% of its income) suggests that the company has been able to achieve a high growth in earnings despite returning most of its income to shareholders.
Besides, Sapiens International has been paying dividends over a period of three years. This shows that the company is committed to sharing profits with its shareholders. Upon studying the latest analysts' consensus data, we found that the company's future payout ratio is expected to drop to 29% over the next three years. Accordingly, the expected drop in the payout ratio explains the expected increase in the company's ROE to 17%, over the same period.
Conclusion
In total, we are pretty happy with Sapiens International's performance. We are particularly impressed by the considerable earnings growth posted by the company, which was likely backed by its high ROE. While the company is paying out most of its earnings as dividends, it has been able to grow its earnings in spite of it, so that's probably a good sign. Having said that, the company's earnings growth is expected to slow down, as forecasted in the current analyst estimates. To know more about the latest analysts predictions for the company, check out this visualization of analyst forecasts for the company.
Have feedback on this article? Concerned about the content? Get in touch with us directly. Alternatively, email editorial-team (at) simplywallst.com.
This article by Simply Wall St is general in nature. We provide commentary based on historical data and analyst forecasts only using an unbiased methodology and our articles are not intended to be financial advice. It does not constitute a recommendation to buy or sell any stock, and does not take account of your objectives, or your financial situation. We aim to bring you long-term focused analysis driven by fundamental data. Note that our analysis may not factor in the latest price-sensitive company announcements or qualitative material. Simply Wall St has no position in any stocks mentioned.
Join A Paid User Research Session
You’ll receive a US$30 Amazon Gift card for 1 hour of your time while helping us build better investing tools for the individual investors like yourself. Sign up here
