What Is Sapiens International's (NASDAQ:SPNS) P/E Ratio After Its Share Price Tanked?

Unfortunately for some shareholders, the Sapiens International (NASDAQ:SPNS) share price has dived 32% in the last thirty days. Looking back over the last year, the stock has been a solid performer, with a gain of 23%.
Assuming nothing else has changed, a lower share price makes a stock more attractive to potential buyers. While the market sentiment towards a stock is very changeable, in the long run, the share price will tend to move in the same direction as earnings per share. The implication here is that long term investors have an opportunity when expectations of a company are too low. One way to gauge market expectations of a stock is to look at its Price to Earnings Ratio (PE Ratio). Investors have optimistic expectations of companies with higher P/E ratios, compared to companies with lower P/E ratios.
Check out our latest analysis for Sapiens International
How Does Sapiens International's P/E Ratio Compare To Its Peers?
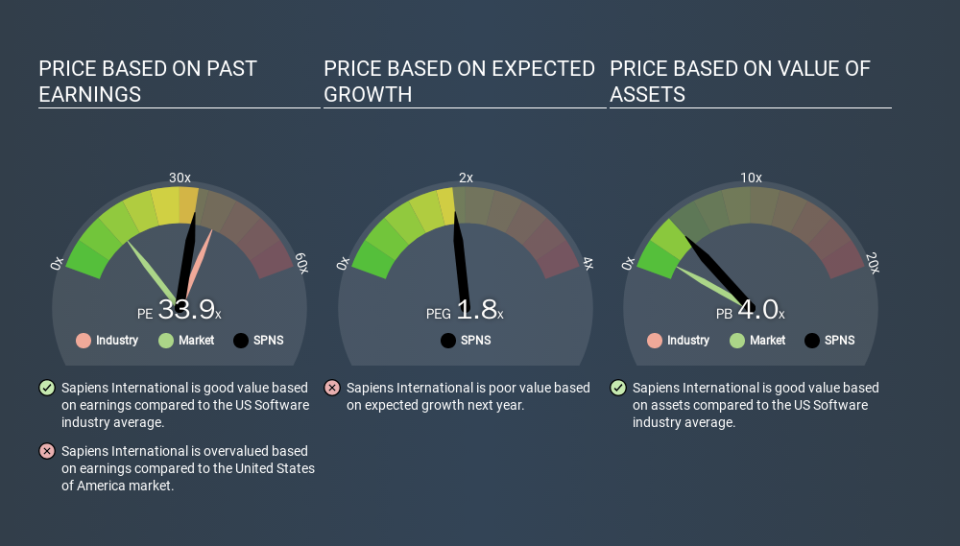
Sapiens International's P/E of 33.93 indicates relatively low sentiment towards the stock. The image below shows that Sapiens International has a lower P/E than the average (39.7) P/E for companies in the software industry.
Its relatively low P/E ratio indicates that Sapiens International shareholders think it will struggle to do as well as other companies in its industry classification. Since the market seems unimpressed with Sapiens International, it's quite possible it could surprise on the upside. You should delve deeper. I like to check if company insiders have been buying or selling.
How Growth Rates Impact P/E Ratios
Earnings growth rates have a big influence on P/E ratios. If earnings are growing quickly, then the 'E' in the equation will increase faster than it would otherwise. And in that case, the P/E ratio itself will drop rather quickly. Then, a lower P/E should attract more buyers, pushing the share price up.
Sapiens International's 90% EPS improvement over the last year was like bamboo growth after rain; rapid and impressive. Having said that, the average EPS growth over the last three years wasn't so good, coming in at 9.9%.
Don't Forget: The P/E Does Not Account For Debt or Bank Deposits
Don't forget that the P/E ratio considers market capitalization. That means it doesn't take debt or cash into account. Hypothetically, a company could reduce its future P/E ratio by spending its cash (or taking on debt) to achieve higher earnings.
Such expenditure might be good or bad, in the long term, but the point here is that the balance sheet is not reflected by this ratio.
Sapiens International's Balance Sheet
Since Sapiens International holds net cash of US$20m, it can spend on growth, justifying a higher P/E ratio than otherwise.
The Verdict On Sapiens International's P/E Ratio
Sapiens International has a P/E of 33.9. That's higher than the average in its market, which is 14.0. The excess cash it carries is the gravy on top its fast EPS growth. To us, this is the sort of company that we would expect to carry an above average price tag (relative to earnings). What can be absolutely certain is that the market has become significantly less optimistic about Sapiens International over the last month, with the P/E ratio falling from 49.6 back then to 33.9 today. For those who prefer to invest with the flow of momentum, that might be a bad sign, but for a contrarian, it may signal opportunity.
Investors should be looking to buy stocks that the market is wrong about. People often underestimate remarkable growth -- so investors can make money when fast growth is not fully appreciated. So this free visual report on analyst forecasts could hold the key to an excellent investment decision.
But note: Sapiens International may not be the best stock to buy. So take a peek at this free list of interesting companies with strong recent earnings growth (and a P/E ratio below 20).
If you spot an error that warrants correction, please contact the editor at editorial-team@simplywallst.com. This article by Simply Wall St is general in nature. It does not constitute a recommendation to buy or sell any stock, and does not take account of your objectives, or your financial situation. Simply Wall St has no position in the stocks mentioned.
We aim to bring you long-term focused research analysis driven by fundamental data. Note that our analysis may not factor in the latest price-sensitive company announcements or qualitative material. Thank you for reading.
