Science Applications (SAIC) Q2 Earnings & Sales Beat Estimates
Science Applications International Corporation SAIC reported second-quarter fiscal 2024 adjusted earnings of $2.05 per share, surpassing the Zacks Consensus Estimate by 25.15%. The figure increased 17.1% year over year.
Revenues decreased 2.6% year over year to $1.78 billion but outpaced the consensus mark by 5.43%. The year-over-year decline was primarily attributed to the sale of the logistics and supply chain management business, the deconsolidation of the Forfeiture Support Associates J.V. and contract completions.
Adjusted EBITDA was $174 million, up 5% year over year. The adjusted EBITDA margin expanded 70 basis points (bps) on a year-over-year basis to 9.8%. The year-over-year growth was driven by strong program performance and cost-efficiency initiatives.
Quarter in Detail
Net bookings for the fiscal second quarter were $0.7 billion, reflecting a book-to-bill ratio of 0.4. SAIC’s estimated backlog of signed business deals was $22.5 billion at the end of the fiscal second quarter, of which $3.7 billion was funded.
Selling, general and administrative (SG&A) expenses decreased 5.4% year over year to $88 million. SG&A expenses, as a percentage of revenues, declined 10 bps to 4.9%.
Science Applications International Corporation Price, Consensus and EPS Surprise
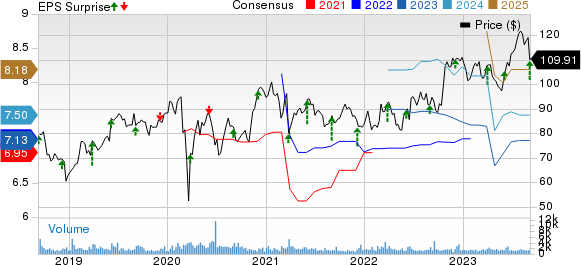
Science Applications International Corporation price-consensus-eps-surprise-chart | Science Applications International Corporation Quote
Non-GAAP operating income increased 7.2% year over year to $134 million. The non-GAAP operating margin expanded 70 bps year over year to 7.5%.
Balance Sheet & Cash Flow Details
Science Applications ended the fiscal second quarter with cash and cash equivalents of $352 million, down from the prior quarter’s $422 million.
As of Aug 4, 2023, Science Applications’ long-term debt (net of the current portion) was $2.22 billion compared with $2.33 billion as of May 5, 2023.
The company generated operating and free cash flows of $150 million and $144 million, respectively, in the fiscal second quarter. The company generated operating and free cash flows of $82 million and $76 million, respectively, in the previous quarter.
Raised Fiscal 2024 Guidance
SAIC raised its guidance for the full fiscal 2024. The company now anticipates revenues in the band of $7.20-$7.25 billion in fiscal 2024 instead of the earlier projected range of $7.125-$7.225 billion.
Science Applications now expects adjusted earnings in the band of $7.20-$7.40 per share, up from the previous range of $7-$7.20.
SAIC still expects to generate free cash flow between $460 million and $480 million in fiscal 2024. It continues to project the adjusted EBITDA margin between 9.3% and 9.4% in fiscal 2024.
Zacks Rank & Stocks to Consider
Science Applications currently carries a Zacks Rank #3 (Hold).
Check Point Software CHKP, Freshwork FRSH, and Splunk SPLK are some better-ranked stocks that investors can consider in the broader sector. While Check Point Software and Freshwork carry a Zacks Rank #2 (Buy) each, Splunk sports a Zacks Rank #1 (Strong Buy). You can see the complete list of today’s Zacks #1 Rank stocks here.
Check Point Software shares have gained 7.5% year to date. The long-term earnings growth rate is pegged at 7.57%.
Freshwork shares have gained 57.6% year to date. The long-term earnings growth rate is pegged at 30%.
Splunk shares have gained 44% year to date. The long-term earnings growth rate is pegged at 24.71%.
Want the latest recommendations from Zacks Investment Research? Today, you can download 7 Best Stocks for the Next 30 Days. Click to get this free report
Check Point Software Technologies Ltd. (CHKP) : Free Stock Analysis Report
Splunk Inc. (SPLK) : Free Stock Analysis Report
Science Applications International Corporation (SAIC) : Free Stock Analysis Report
Freshworks Inc. (FRSH) : Free Stock Analysis Report
