Scorpio Tankers (STNG): A Comprehensive Analysis of Its Market Value
Scorpio Tankers Inc (NYSE:STNG) recently experienced a daily gain of 3.25% and a 3-month gain of 29.38%. With an Earnings Per Share (EPS) (EPS) of 14.35, the question arises: Is the stock modestly overvalued? In this article, we'll delve into a comprehensive valuation analysis to answer this question. So, let's get started.
About Scorpio Tankers Inc
Scorpio Tankers Inc is a leading provider of marine transportation of petroleum products. It owns, lease finances or bareboat charters-in 113 product tankers, including 39 LR2 tankers, 60 MR tankers, and 14 Handymax tankers. The company's fleet of tankers is the largest, most eco-friendly, and newest fleet on the water hauling clean petroleum products. Currently, Scorpio Tankers' stock price is $54.94, while the GF Value, an estimation of fair value, is at $42.82.
Understanding the GF Value
The GF Value is a proprietary measure of a stock's intrinsic value, computed by considering three key factors: historical trading multiples, a GuruFocus adjustment factor based on past performance and growth, and future business performance estimates. The GF Value Line on our summary page provides an overview of the fair value at which the stock should ideally be traded.
Scorpio Tankers (NYSE:STNG) appears to be modestly overvalued based on GuruFocus' valuation method. At its current price of $54.94 per share, Scorpio Tankers has a market cap of $2.90 billion. This suggests that the long-term return of its stock is likely to be lower than its business growth due to its relative overvaluation.

Link: These companies may deliver higher future returns at reduced risk.
Financial Strength
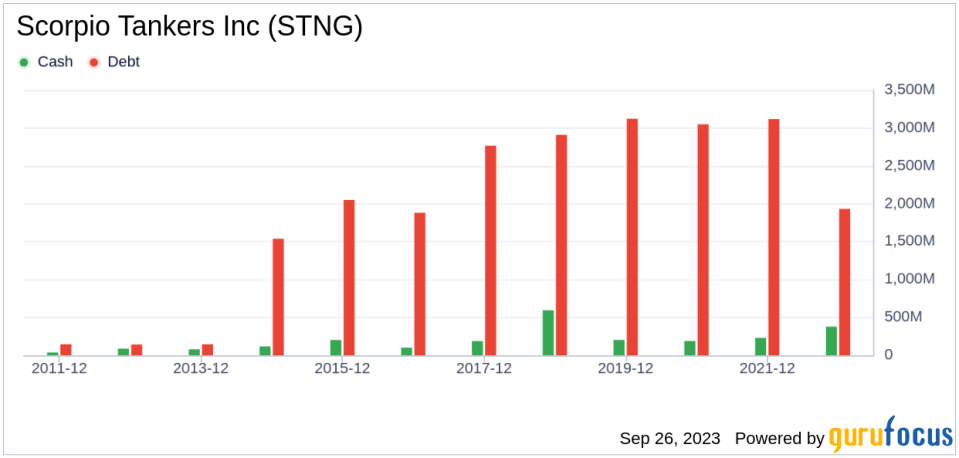
Before investing in any company, it's crucial to check its financial strength. Scorpio Tankers has a cash-to-debt ratio of 0.17, which is lower than 72.15% of 1034 companies in the Oil & Gas industry. This indicates that the financial strength of Scorpio Tankers is fair, with a score of 6 out of 10.
Profitability and Growth
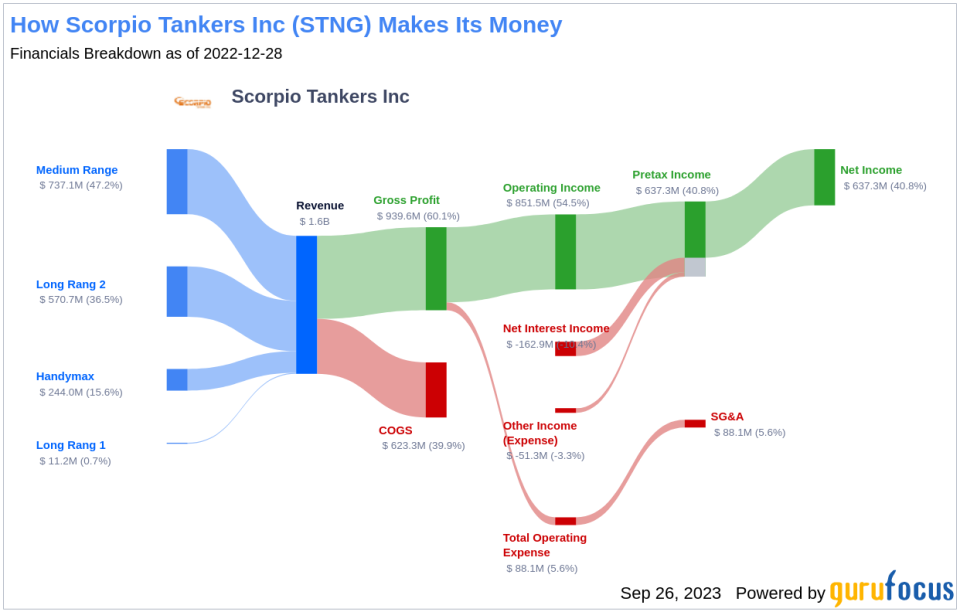
Investing in profitable companies, especially those with consistent profitability over the long term, is typically less risky. Scorpio Tankers has been profitable 5 times over the past 10 years. Over the past twelve months, the company had a revenue of $1.70 billion and an Earnings Per Share (EPS) of $14.35. Its operating margin is 59%, which ranks better than 94.51% of 984 companies in the Oil & Gas industry.
Scorpio Tankers's 3-year average revenue growth rate is better than 71.46% of 862 companies in the Oil & Gas industry. Its 3-year average EBITDA growth rate is 32.5%, which ranks better than 70.69% of 829 companies in the Oil & Gas industry.
ROIC vs WACC
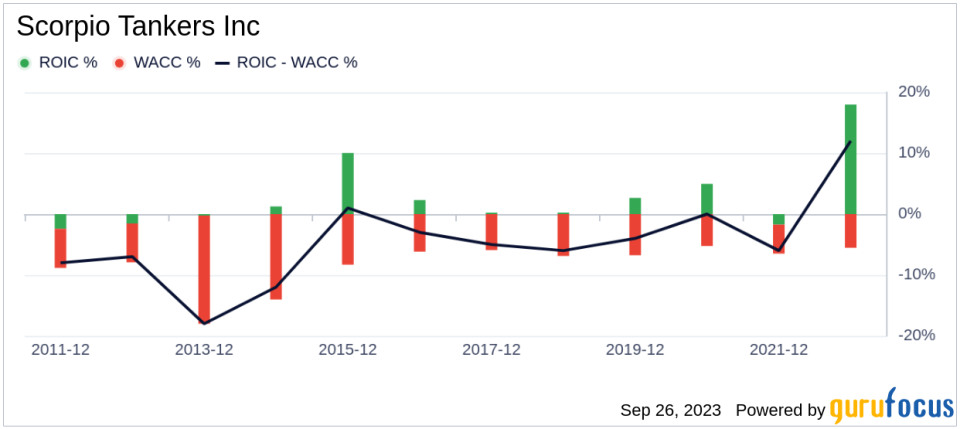
Comparing a company's return on invested capital (ROIC) to its weighted average cost of capital (WACC) can also evaluate its profitability. Return on invested capital (ROIC) measures how well a company generates cash flow relative to the capital it has invested in its business. The weighted average cost of capital (WACC) is the rate that a company is expected to pay on average to all its security holders to finance its assets. During the past 12 months, Scorpio Tankers's ROIC was 23.51 while its WACC came in at 5.06.
Conclusion
In summary, Scorpio Tankers (NYSE:STNG) appears to be modestly overvalued. The company's financial condition is fair, and its profitability is fair. Its growth ranks better than 70.69% of 829 companies in the Oil & Gas industry. To learn more about Scorpio Tankers stock, you can check out its 30-Year Financials here.
To find out the high-quality companies that may deliver above-average returns, please check out GuruFocus High Quality Low Capex Screener.
This article first appeared on GuruFocus.
