SDI Group (LON:SDI) sheds 16% this week, as yearly returns fall more in line with earnings growth
SDI Group plc (LON:SDI) shareholders might understandably be very concerned that the share price has dropped 37% in the last quarter. But that scarcely detracts from the really solid long term returns generated by the company over five years. Indeed, the share price is up an impressive 114% in that time. Generally speaking the long term returns will give you a better idea of business quality than short periods can. Only time will tell if there is still too much optimism currently reflected in the share price.
Since the long term performance has been good but there's been a recent pullback of 16%, let's check if the fundamentals match the share price.
View our latest analysis for SDI Group
To quote Buffett, 'Ships will sail around the world but the Flat Earth Society will flourish. There will continue to be wide discrepancies between price and value in the marketplace...' One imperfect but simple way to consider how the market perception of a company has shifted is to compare the change in the earnings per share (EPS) with the share price movement.
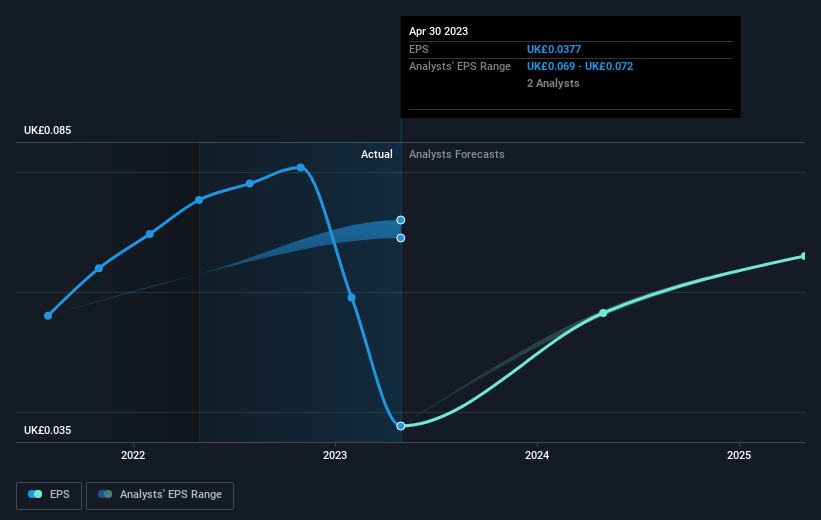
Over half a decade, SDI Group managed to grow its earnings per share at 16% a year. So the EPS growth rate is rather close to the annualized share price gain of 16% per year. That suggests that the market sentiment around the company hasn't changed much over that time. In fact, the share price seems to largely reflect the EPS growth.
You can see how EPS has changed over time in the image below (click on the chart to see the exact values).
It might be well worthwhile taking a look at our free report on SDI Group's earnings, revenue and cash flow.
A Different Perspective
While the broader market gained around 4.7% in the last year, SDI Group shareholders lost 48%. Even the share prices of good stocks drop sometimes, but we want to see improvements in the fundamental metrics of a business, before getting too interested. On the bright side, long term shareholders have made money, with a gain of 16% per year over half a decade. It could be that the recent sell-off is an opportunity, so it may be worth checking the fundamental data for signs of a long term growth trend. While it is well worth considering the different impacts that market conditions can have on the share price, there are other factors that are even more important. Consider for instance, the ever-present spectre of investment risk. We've identified 2 warning signs with SDI Group , and understanding them should be part of your investment process.
If you would prefer to check out another company -- one with potentially superior financials -- then do not miss this free list of companies that have proven they can grow earnings.
Please note, the market returns quoted in this article reflect the market weighted average returns of stocks that currently trade on British exchanges.
Have feedback on this article? Concerned about the content? Get in touch with us directly. Alternatively, email editorial-team (at) simplywallst.com.
This article by Simply Wall St is general in nature. We provide commentary based on historical data and analyst forecasts only using an unbiased methodology and our articles are not intended to be financial advice. It does not constitute a recommendation to buy or sell any stock, and does not take account of your objectives, or your financial situation. We aim to bring you long-term focused analysis driven by fundamental data. Note that our analysis may not factor in the latest price-sensitive company announcements or qualitative material. Simply Wall St has no position in any stocks mentioned.
