Seagate Technology Holdings PLC (STX): A Deep Dive into Its Performance Potential
Long-established in the Hardware industry, Seagate Technology Holdings PLC (NASDAQ:STX) has enjoyed a stellar reputation. It has recently witnessed a daily gain of 2.22%, juxtaposed with a three-month change of 12.1%. However, fresh insights from the GF Score hint at potential headwinds. Notably, its diminished rankings in financial strength, growth, and valuation suggest that the company might not live up to its historical performance. Join us as we dive deep into these pivotal metrics to unravel the evolving narrative of Seagate Technology Holdings PLC.
Understanding the GF Score
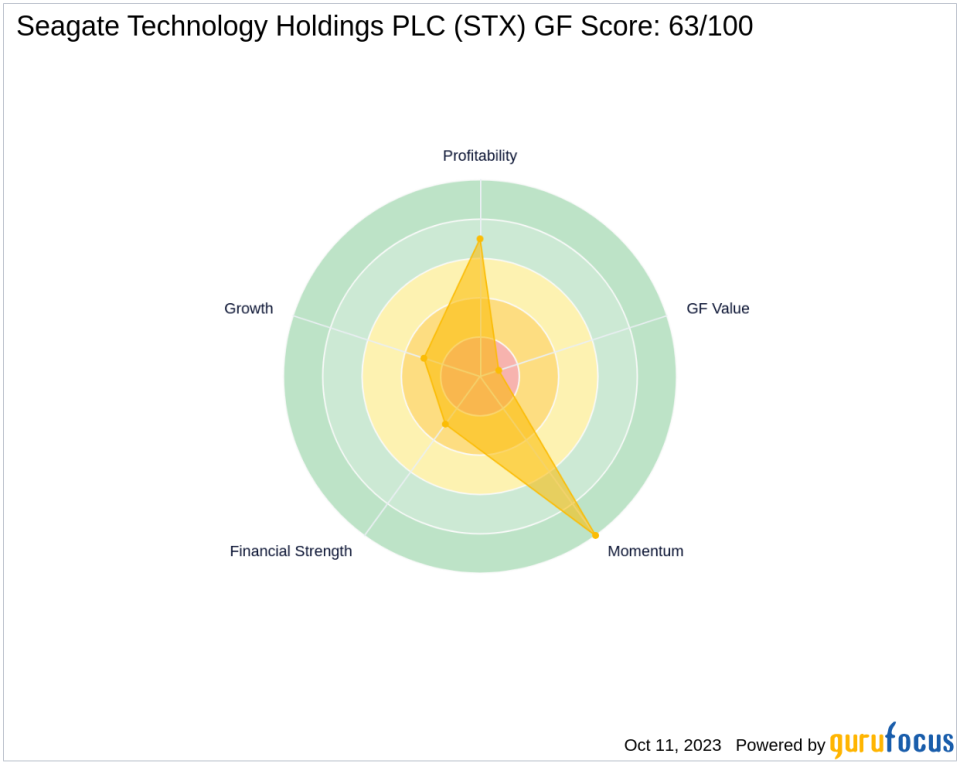
The GF Score is a stock performance ranking system developed by GuruFocus using five aspects of valuation, which has been found to be closely correlated to the long-term performances of stocks by backtesting from 2006 to 2021. The stocks with a higher GF Score generally generate higher returns than those with a lower GF Score. Therefore, when picking stocks, investors should invest in companies with high GF Scores. The GF Score ranges from 0 to 100, with 100 as the highest rank.
Financial strength rank: 3/10
Profitability rank: 7/10
Growth rank: 3/10
GF Value rank: 1/10
Momentum rank: 10/10
Based on the above method, GuruFocus assigned Seagate Technology Holdings PLC the GF Score of 63 out of 100, which signals poor future outperformance potential.
Seagate Technology Holdings PLC: A Snapshot
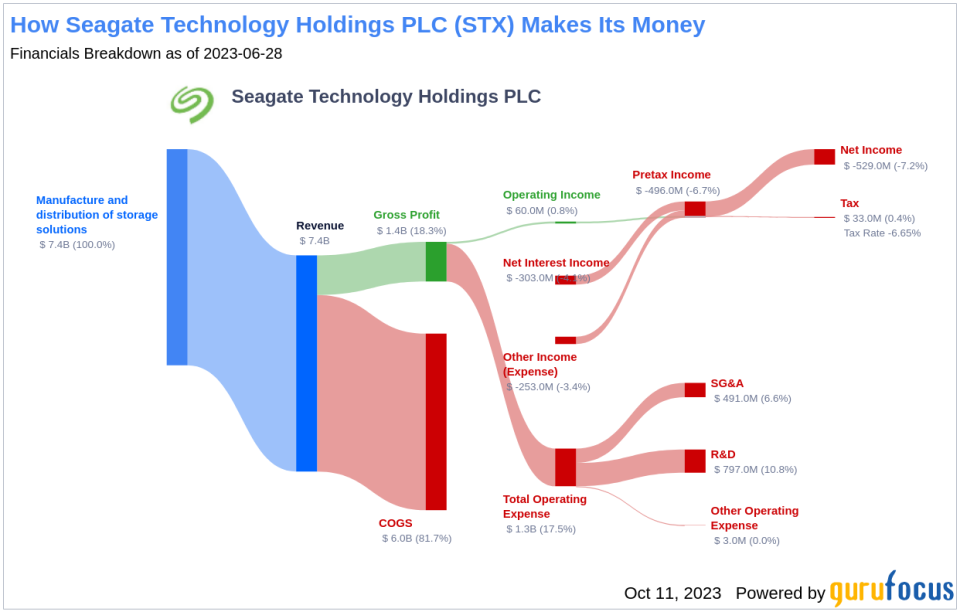
Seagate Technology Holdings PLC, with a market cap of $14.15 billion, is a leading supplier of hard disk drives for data storage to the enterprise and consumer markets. It forms a practical duopoly in the market with its chief rival, Western Digital; they are both vertically integrated. The company's sales stand at $7.38 billion, with an operating margin of 0.81.
Financial Strength Analysis
Seagate Technology Holdings PLC's financial strength indicators present some concerning insights about the company's balance sheet health. The company's interest coverage ratio of 0.19 positions it worse than 99.13% of 1608 companies in the Hardware industry. This ratio highlights potential challenges the company might face when handling its interest expenses on outstanding debt.
The company's Altman Z-Score is just 0.29, which is below the distress zone of 1.81. This suggests that the company may face financial distress over the next few years. Additionally, the company's low cash-to-debt ratio at 0.14 indicates a struggle in handling existing debt levels. Furthermore, the company's debt-to-Ebitda ratio is 17.68, which is above Joel Tillinghast's warning level of 4 and is worse than 95.83% of 1680 companies in the Hardware industry.
Growth Prospects
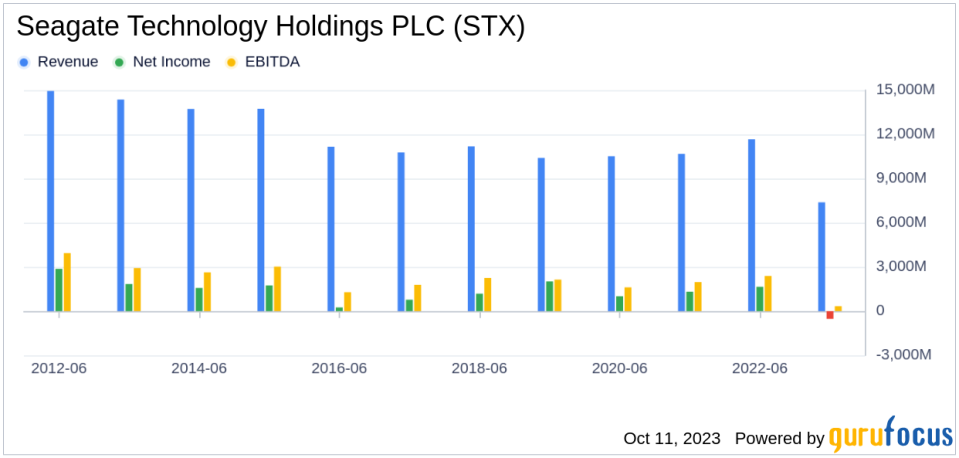
A lack of significant growth is another area where Seagate Technology Holdings PLC seems to falter, as evidenced by the company's low Growth rank. The company's revenue has declined by -3.5 per year over the past three years, which underperforms worse than 72.22% of 2325 companies in the Hardware industry. Over the past five years, Seagate Technology Holdings PLC has witnessed a decline in its earnings before interest, taxes, depreciation, and amortization (EBITDA).
Conclusion
Given the company's financial strength, profitability, and growth metrics, the GF Score highlights the firm's unparalleled position for potential underperformance. While Seagate Technology Holdings PLC has a strong reputation in the hardware industry, its financial health and growth prospects raise concerns about its ability to maintain its historical performance. As value investors, it's crucial to consider these factors when evaluating the company's future potential.
GuruFocus Premium members can find more companies with strong GF Scores using the following screener link: GF Score Screen
This article, generated by GuruFocus, is designed to provide general insights and is not tailored financial advice. Our commentary is rooted in historical data and analyst projections, utilizing an impartial methodology, and is not intended to serve as specific investment guidance. It does not formulate a recommendation to purchase or divest any stock and does not consider individual investment objectives or financial circumstances. Our objective is to deliver long-term, fundamental data-driven analysis. Be aware that our analysis might not incorporate the most recent, price-sensitive company announcements or qualitative information. GuruFocus holds no position in the stocks mentioned herein.
This article first appeared on GuruFocus.
