Select Medical Holdings' (NYSE:SEM) three-year total shareholder returns outpace the underlying earnings growth
By buying an index fund, investors can approximate the average market return. But if you choose individual stocks with prowess, you can make superior returns. For example, the Select Medical Holdings Corporation (NYSE:SEM) share price is up 58% in the last three years, clearly besting the market return of around 34% (not including dividends). However, more recent returns haven't been as impressive as that, with the stock returning just 3.3% in the last year , including dividends .
While the stock has fallen 4.1% this week, it's worth focusing on the longer term and seeing if the stocks historical returns have been driven by the underlying fundamentals.
Check out our latest analysis for Select Medical Holdings
To paraphrase Benjamin Graham: Over the short term the market is a voting machine, but over the long term it's a weighing machine. One imperfect but simple way to consider how the market perception of a company has shifted is to compare the change in the earnings per share (EPS) with the share price movement.
Select Medical Holdings was able to grow its EPS at 4.7% per year over three years, sending the share price higher. This EPS growth is lower than the 16% average annual increase in the share price. This suggests that, as the business progressed over the last few years, it gained the confidence of market participants. It is quite common to see investors become enamoured with a business, after a few years of solid progress.
The graphic below depicts how EPS has changed over time (unveil the exact values by clicking on the image).
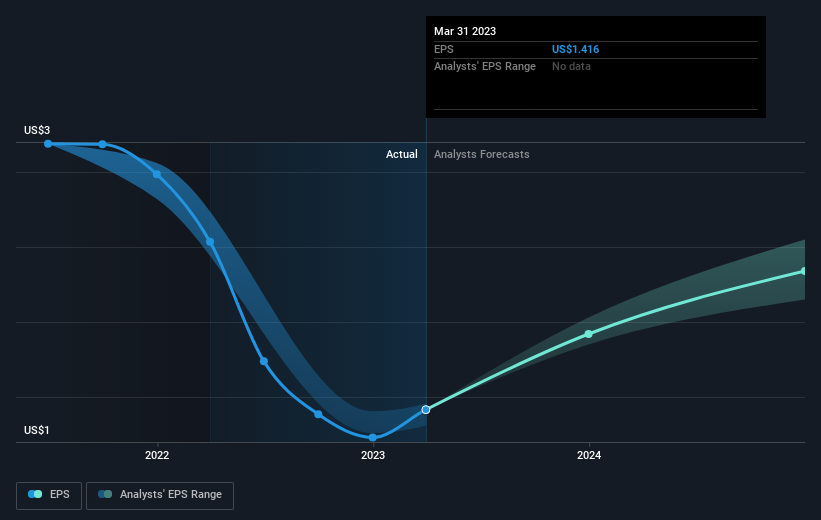
Dive deeper into Select Medical Holdings' key metrics by checking this interactive graph of Select Medical Holdings's earnings, revenue and cash flow.
What About Dividends?
When looking at investment returns, it is important to consider the difference between total shareholder return (TSR) and share price return. The TSR is a return calculation that accounts for the value of cash dividends (assuming that any dividend received was reinvested) and the calculated value of any discounted capital raisings and spin-offs. It's fair to say that the TSR gives a more complete picture for stocks that pay a dividend. We note that for Select Medical Holdings the TSR over the last 3 years was 64%, which is better than the share price return mentioned above. This is largely a result of its dividend payments!
A Different Perspective
Select Medical Holdings shareholders are up 3.3% for the year (even including dividends). But that was short of the market average. If we look back over five years, the returns are even better, coming in at 9% per year for five years. It's quite possible the business continues to execute with prowess, even as the share price gains are slowing. It's always interesting to track share price performance over the longer term. But to understand Select Medical Holdings better, we need to consider many other factors. To that end, you should learn about the 4 warning signs we've spotted with Select Medical Holdings (including 1 which makes us a bit uncomfortable) .
Of course, you might find a fantastic investment by looking elsewhere. So take a peek at this free list of companies we expect will grow earnings.
Please note, the market returns quoted in this article reflect the market weighted average returns of stocks that currently trade on American exchanges.
Have feedback on this article? Concerned about the content? Get in touch with us directly. Alternatively, email editorial-team (at) simplywallst.com.
This article by Simply Wall St is general in nature. We provide commentary based on historical data and analyst forecasts only using an unbiased methodology and our articles are not intended to be financial advice. It does not constitute a recommendation to buy or sell any stock, and does not take account of your objectives, or your financial situation. We aim to bring you long-term focused analysis driven by fundamental data. Note that our analysis may not factor in the latest price-sensitive company announcements or qualitative material. Simply Wall St has no position in any stocks mentioned.
Join A Paid User Research Session
You’ll receive a US$30 Amazon Gift card for 1 hour of your time while helping us build better investing tools for the individual investors like yourself. Sign up here
