Selective Insurance (SIGI) Q1 Earnings Lag on Higher Cat Loss
Selective Insurance Group, Inc. SIGI reported first-quarter 2023 operating income of $1.44 per share, which missed the Zacks Consensus Estimate by 8.2% and our estimate of $2.09. The bottom line, however, increased 2.1% from the year-ago quarter.
The quarter witnessed higher net premiums written (NPW) and increased net investment income. The results were offset by lower underwriting income and wider catastrophe loss.
Selective Insurance Group, Inc. Price, Consensus and EPS Surprise
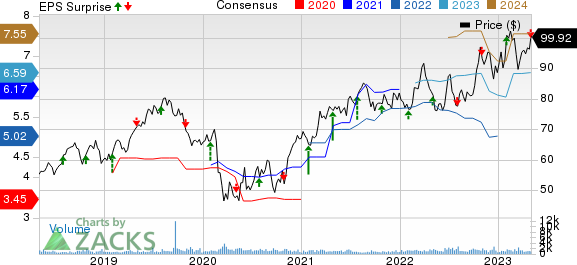
Selective Insurance Group, Inc. price-consensus-eps-surprise-chart | Selective Insurance Group, Inc. Quote
Behind the Headlines
Total revenues of $996.5 million increased 12.4% from the year-ago quarter’s figure, primarily due to higher premiums earned and improved net investment income. The top line missed the Zacks Consensus Estimate by 0.4% and beat our estimate of $995.2 million.
On a year-over-year basis, NPW increased 12% to $999.8 million, driven by renewal pure price increases, solid retention, new business and strong exposure growth. The figure was lower than our estimate of $1 billion.
After-tax net investment income improved 25% year over year to $73 million, driven by higher book yields from the investment of operating and investing cash flows over the past year in the higher interest rate environment.
Underwriting income declined 30% to $31 million. Net catastrophe loss of $55.3 million was wider than a loss of $20.6 million incurred in the year-ago quarter. Non catastrophe loss of $148.2 million was narrower than a loss of $150.4 million incurred in the year-ago quarter.
The combined ratio deteriorated 260 basis points (bps) on a year-over-year basis to 95.7, driven principally by higher catastrophe losses and lower prior year favorable casualty reserve development.
Total expenses increased 14% year over year to $885.1 million, primarily due to higher loss and loss expenses incurred, amortization of deferred policy acquisition costs, other insurance expenses and corporate costs. The figure was higher than our estimate of $786.2 million.
Segmental Results
Standard Commercial Lines’ NPW was up 10% year over year to $813.3 million. The figure was lower than our estimate of $841.7 million. Average renewal pure price increases of 7%, strong exposure growth and solid retention of 86% and new business growth of 15% drove the improvement in NPW.
The combined ratio deteriorated 110 bps to 94.7.
Standard Personal Lines’ NPW was up 31% year over year to $85.3 million. The figure was higher than our estimate of $65.1 million. Renewal pure price increases averaged 1.8%, retention was 87% and new business was up $16.7 million year over year.
The combined ratio deteriorated 2500 bps on a year-over-year basis to 116.
Excess & Surplus Lines’ NPW was up 16% year over year to $101.2 million, driven by average renewal pure price increases of 7.4% and new business growth of 9%. The figure was higher than our estimate of $99.8 million.
The combined ratio also improved 610 bps to 85.
Financial Update
Selective Insurance exited first-quarter 2023 with total assets of $11 billion, which grew 2% from December 2021 end. Long-term debt of $504.2 million was flat with the 2022 level.
Debt-to-total capitalization improved 70 bps to 15.9% at first-quarter 2023 end.
As of Mar 31, 2023, book value per share was $40.82, up 6% from the level as of 2022 end.
Annualized non-GAAP operating return on common equity was 14.6% in the first quarter of 2023, which expanded 180 bps year over year.
Capital Deployment
In the reported quarter, Selective Insurance did not repurchase any shares. It had $84.2 million remaining under authorization as of Mar 31, 2023.
2023 Guidance
Selective Insurance estimates GAAP combined ratio of 96.5%, including net catastrophe losses of 4.5 points.
After-tax net investment income of $300 million included after-tax net investment income from alternative four investments of $30 million.
The overall effective tax rate is expected to be around 21%, which assumes an effective tax rate of 20% for net investment income and 21% for all other items.
Zacks Rank
Selective Insurance carries a Zacks Rank #2 (Buy) at present. You can see the complete list of today’s Zacks #1 Rank (Strong Buy) stocks here.
Performance of Other Property & Casualty Insurers
AXIS Capital Holdings Limited AXS posted first-quarter 2023 operating income of $2.33 per share, beating the Zacks Consensus Estimate by 23.2%. The bottom line increased 11.5% year over year. Total operating revenues of $1.3 billion missed the Zacks Consensus Estimate by 6.7%. The top line, however, rose 0.6% year over year on higher net investment income. Net investment income increased 47.2% year over year to $134 million, primarily attributable to an increase in income from fixed maturities due to improved yields.
Total expenses in the quarter under review increased 1.9% year over year to $1.14 billion, attributable to higher interest expense and financing costs. Pre-tax catastrophe and weather-related losses and net of reinsurance were $38 million, primarily attributable to New Zealand floods, Cyclone Gabrielle and other weather-related events. This compares favorably with the year-ago loss of $60 million. AXIS Capital’s underwriting income of $139.4 million increased 0.4% year over year. The combined ratio improved 50 bps to 90.9.
First American Financial Corporation FAF reported first-quarter 2023 operating income per share of 49 cents, which beat the Zacks Consensus Estimate by a cent. The bottom line decreased 58.1% year over year. Operating revenues of $1.4 billion decreased 29% year over year. The top line beat the Zacks Consensus Estimate by 1.5%. The figure was in line with our estimate.
Investment income was $125 million in the first quarter, more than double year over year. The increase was primarily due to rising interest rates, which drove higher interest income from the cash and investment portfolio, escrow balances and tax-deferred property exchange balances. The impact of higher interest rates was partly offset by lower average balances, primarily in the company’s escrow and tax-deferred exchange balances. The figure was lower than our estimate of $144 million.
American Financial Group, Inc. AFG reported first-quarter 2023 net operating earnings per share of $2.89, which surpassed the Zacks Consensus Estimate by 0.3% as well as our estimate of $2.72 per share. The bottom line decreased 18.8% year over year. Total revenues of $1.7 billion increased 11.3% year over year in the quarter. The growth came on the back of higher P&C insurance net earned premiums and other income. The top line beat the Zacks Consensus Estimate by 4.5% and matched our estimate of $1.7 billion.
P&C insurance net earned premiums of $1.4 billion climbed 10.4% year over year. Net investment income decreased 5.6% year over year to $217 million in the quarter under review. The figure was higher than our estimate of $169.3 million. Total cost and expenses increased 20.3% year over year to $1.4 billion due to higher P&C insurance losses and expenses, cost of managed investment entities and other expenses. The figure matched our estimate of $1.4 billion.
Want the latest recommendations from Zacks Investment Research? Today, you can download 7 Best Stocks for the Next 30 Days. Click to get this free report
Axis Capital Holdings Limited (AXS) : Free Stock Analysis Report
First American Financial Corporation (FAF) : Free Stock Analysis Report
American Financial Group, Inc. (AFG) : Free Stock Analysis Report
Selective Insurance Group, Inc. (SIGI) : Free Stock Analysis Report
