Is Semtech (SMTC) Too Good to Be True? A Comprehensive Analysis of a Potential Value Trap
Value-focused investors are always on the hunt for stocks that are priced below their intrinsic value. One such stock that merits attention is Semtech Corp (NASDAQ:SMTC). The stock, which is currently priced at 23.31, recorded a loss of 5.78% in a day and a 3-month decrease of 9.53%. The stock's fair valuation is $80.02, as indicated by its GF Value.
Understanding GF Value
The GF Value represents the current intrinsic value of a stock derived from our exclusive method. The GF Value Line on our summary page gives an overview of the fair value that the stock should be traded at. It is calculated based on three factors:
1. Historical multiples (PE Ratio, PS Ratio, PB Ratio and Price-to-Free-Cash-Flow) that the stock has traded at.
2. GuruFocus adjustment factor based on the company's past returns and growth.
3. Future estimates of the business performance.
We believe the GF Value Line is the fair value that the stock should be traded at. The stock price will most likely fluctuate around the GF Value Line. If the stock price is significantly above the GF Value Line, it is overvalued and its future return is likely to be poor. On the other hand, if it is significantly below the GF Value Line, its future return will likely be higher.
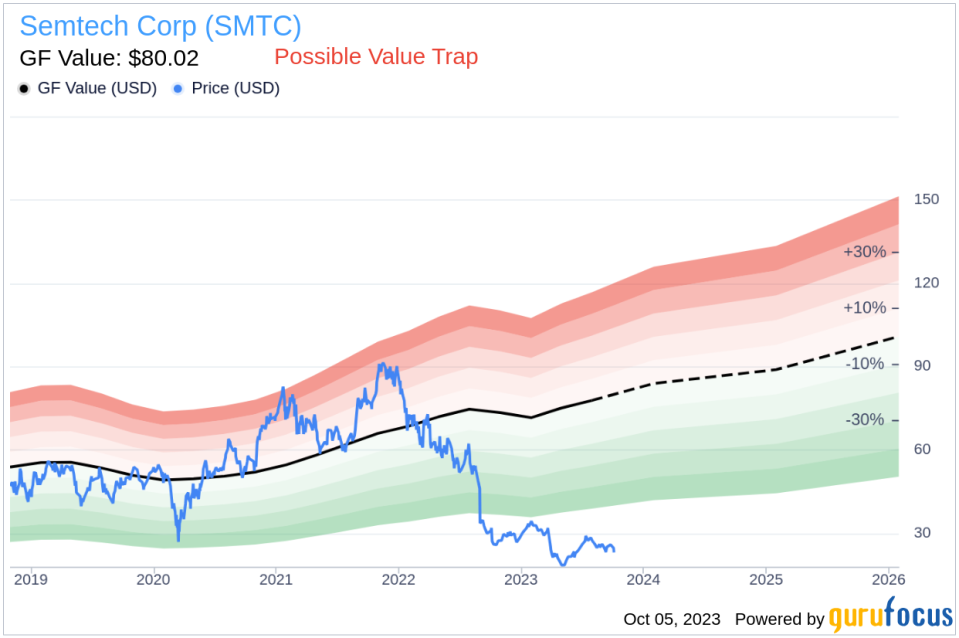
However, investors need to consider a more in-depth analysis before making an investment decision. Despite its seemingly attractive valuation, certain risk factors associated with Semtech should not be ignored. These risks are primarily reflected through its low Piotroski F-score of 1, Altman Z-score of 0.9, and These indicators suggest that Semtech, despite its apparent undervaluation, might be a potential value trap. This complexity underlines the importance of thorough due diligence in investment decision-making.
Decoding the Piotroski F-score and Altman Z-score
The Piotroski F-score, created by accounting professor Joseph Piotroski, is a tool used to assess the strength of a company's financial health. The score is based on nine criteria that fall into three categories: profitability, leverage/liquidity/ source of funds, and operating efficiency. The overall score ranges from 0 to 9, with higher scores indicating healthier financials. Semtech's current Piotroski F-Score, however, falls in the lower end of this spectrum, indicating potential red flags for investors.
Before delving into the details, let's understand what the Altman Z-score entails. Invented by New York University Professor Edward I. Altman in 1968, the Z-Score is a financial model that predicts the probability of a company entering bankruptcy within a two-year time frame. The Altman Z-Score combines five different financial ratios, each weighted to create a final score. A score below 1.8 suggests a high likelihood of financial distress, while a score above 3 indicates a low risk.
Company Snapshot: Semtech Corp (NASDAQ:SMTC)
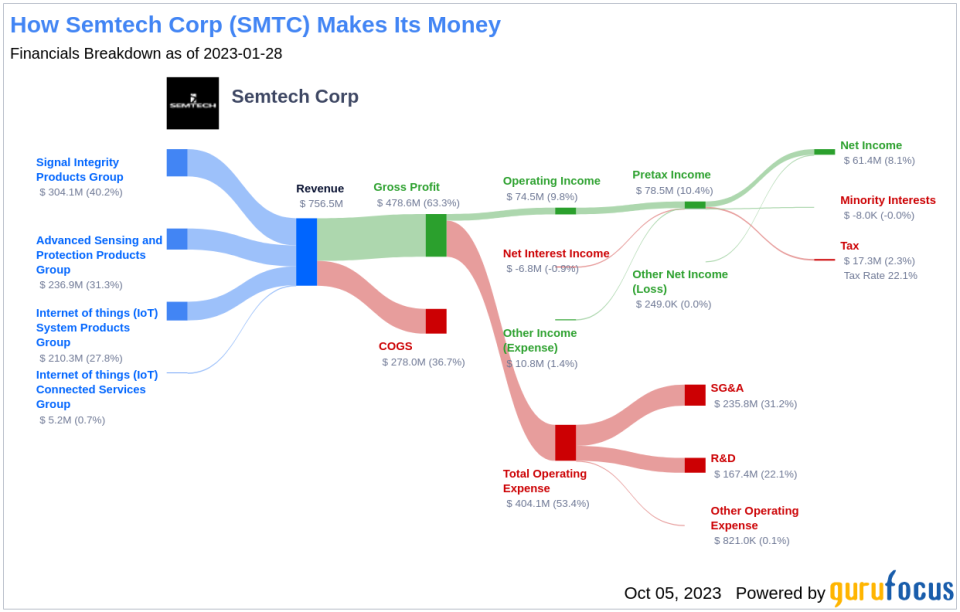
Semtech Corp is engaged in designing, developing, manufacturing and marketing analog and mixed-signal semiconductors, algorithms and wireless semiconductors, connectivity modules, gateways, routers and connected services for IoT. The company operates in four reportable segments' 1) Signal Integrity, 2) Advanced Protection and Sensing, 3) IoT System and 4) IoT Connected Services. The majority of the company's revenue is earned through Advanced Protection and Sensing Products segment. Geographically majority of the company's revenue is earned from Asia Pacific region.
Analysis of Semtech's' Profitability
Firstly, let's address profitability. One significant component of the F-Score is a positive return on assets (ROA). A closer look at Semtech's ROA reveals a worrying trend of negative returns. This indicates the company's inability to generate profit from its assets - a fundamental concern for any investor.
Let's delve deeper into Semtech's financial health by examining the decline in its return on assets (ROA) over the past three years. The data indicates 2021: 8.46; 2022: 14.02; 2023: -22.31, when expressed in percentages. Such a decrease is concerning, as the Piotroski F-Score penalizes companies with lower current ROA compared to the previous period. This ongoing decline highlights another potential risk associated with investing in Semtech.
Observing the financials of Semtech, it's important to note that the cash flow from operations over the trailing twelve months (TTM) stands at $-102.61 million, whereas the net income in the same period is significantly higher at $-439.68 million. The Piotroski F-score considers this discrepancy as a potential red flag. The rationale behind this is that a company's operating cash flow is a more direct and less manipulated measure of its cash-generating ability than net income. Net income, while important, is susceptible to accounting treatments and non-cash items which can distort the true cash profitability of the company. If a company consistently shows lower cash flows from operations relative to its net income, it could indicate that the earnings quality is poor and the company might have difficulties sustaining its operations or financing its obligations, a fact which could negatively impact its financial stability and investor confidence.
Leverage, Liquidity and Source of Funds: A Worrying Trend
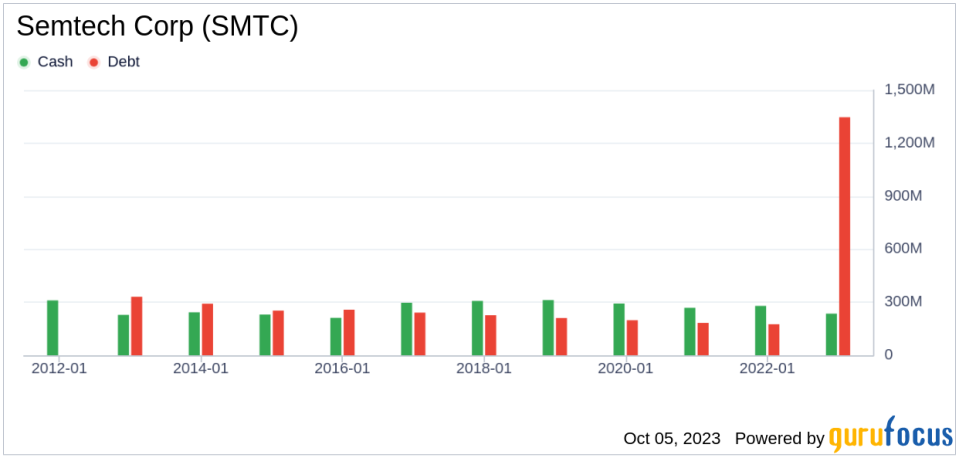
Assessing the aspect of leverage, liquidity, and sources of funds, Semtech demonstrates an alarming rise in its debt-to-total assets ratio over the past three years. The provided data shows 2021: 0.16; 2022: 0.14; 2023: 0.65, expressed as percentages. A higher debt ratio suggests that Semtech is increasingly financing its assets through debt, thereby escalating its financial risk. The Piotroski F-Score views this as a negative indicator, further cautioning investors about Semtech.
Examining Semtech's financial stability, there's a notable decrease in its current ratio over the past three years, as shown by the data 2021: 4.17; 2022: 4.12; 2023: 1.96, which is expressed as percentages. The current ratio is a key indicator of a company's short-term financial health, as it gauges the ability to cover short-term liabilities with short-term assets. A declining current ratio suggests that Semtech's liquidity and capability to manage immediate financial obligations are deteriorating.
Operating Efficiency: A Darker Picture
Lastly, concerning operating efficiency, the Piotroski F-score examines changes in gross margin and asset turnover. Regrettably, Semtech follows a discouraging trajectory with a decrease in gross margin percentage over the past three years, as demonstrated by the data provided: 2021: 60.40; 2022: 63.35; 2023: 50.75 (expressed in percentages). This contraction in gross margin suggests that Semtech is grappling with either an escalation in the cost of goods sold or dwindling prices - both of which are inauspicious indicators for profitability.
In terms of operational efficiency, another key indicator, Semtech has unfortunately reported a declining trend in asset turnover over the past three years, as evidenced by the data: 2021: 0.63; 2022: 0.70; 2023: 0.42 (expressed in percentages). Asset turnover measures how effectively a company uses its assets to generate sales, and a decrease in this ratio can indicate a drop in efficiency. This could be due to various factors, such as underutilization of assets or a decline in the market demand for the company's products or services. Consequently, this downward trend in asset turnover implies that Semtech may need to revisit its operational strategies to improve the utilization of its assets and boost its sales volume.
While the Piotroski F-score is not the only lens through which to view a potential investment, it is a robust and comprehensive tool for evaluating a company's financial health. Unfortunately for Semtech, its current score suggests potential troubles.
Semtech's Low Altman Z-Score: A Breakdown of Key Drivers
A dissection of Semtech's Altman Z-score reveals Semtech's financial health may be weak, suggesting possible financial distress:
The first factor we need to consider is a measure of short-term liquidity. This is calculated as the working capital divided by total assets. When we evaluate the data provided: 2021: 0; 2022: 0.00; 2023: -0.01, it's clear that Semtech has experienced a declining trend in its Working Capital to Total Assets ratio over the past few years. This decline suggests potential liquidity issues that the company may be facing. The ratio is strikingly low, which unfavorably influences the overall Z-Score.
The Retained Earnings to Total Assets ratio provides insights into a company's capability to reinvest its profits or manage debt. Evaluating Semtech's historical data, 2021: 0.66; 2022: 0.74; 2023: 0.21, we observe a declining trend in this ratio. This downward movement indicates Semtech's diminishing ability to reinvest in its business or effectively manage its debt. Consequently, it exerts a negative impact on its Z-Score.
The EBIT to Total Assets ratio serves as a crucial barometer of a company's operational effectiveness, correlating earnings before
This article first appeared on GuruFocus.
