Serco Group plc's (LON:SRP) Stock Been Rising: Are Strong Financials Guiding The Market?
Serco Group's (LON:SRP) stock is up by 5.3% over the past three months. Given its impressive performance, we decided to study the company's key financial indicators as a company's long-term fundamentals usually dictate market outcomes. Particularly, we will be paying attention to Serco Group's ROE today.
Return on Equity or ROE is a test of how effectively a company is growing its value and managing investors’ money. In other words, it is a profitability ratio which measures the rate of return on the capital provided by the company's shareholders.
See our latest analysis for Serco Group
How To Calculate Return On Equity?
The formula for ROE is:
Return on Equity = Net Profit (from continuing operations) ÷ Shareholders' Equity
So, based on the above formula, the ROE for Serco Group is:
22% = UK£212m ÷ UK£984m (Based on the trailing twelve months to June 2023).
The 'return' is the profit over the last twelve months. So, this means that for every £1 of its shareholder's investments, the company generates a profit of £0.22.
Why Is ROE Important For Earnings Growth?
Thus far, we have learned that ROE measures how efficiently a company is generating its profits. We now need to evaluate how much profit the company reinvests or "retains" for future growth which then gives us an idea about the growth potential of the company. Assuming everything else remains unchanged, the higher the ROE and profit retention, the higher the growth rate of a company compared to companies that don't necessarily bear these characteristics.
A Side By Side comparison of Serco Group's Earnings Growth And 22% ROE
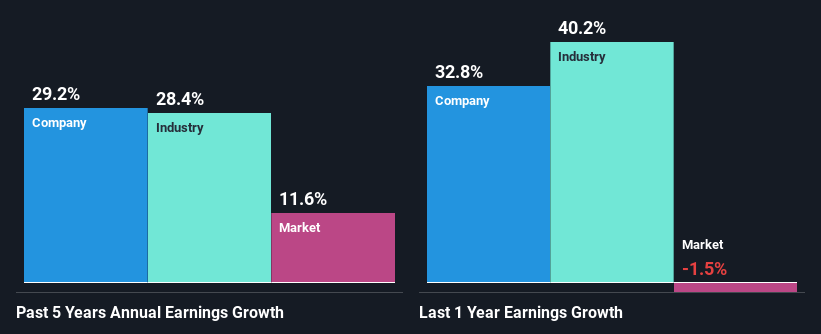
To begin with, Serco Group has a pretty high ROE which is interesting. Secondly, even when compared to the industry average of 13% the company's ROE is quite impressive. So, the substantial 29% net income growth seen by Serco Group over the past five years isn't overly surprising.
We then performed a comparison between Serco Group's net income growth with the industry, which revealed that the company's growth is similar to the average industry growth of 28% in the same 5-year period.
Earnings growth is a huge factor in stock valuation. It’s important for an investor to know whether the market has priced in the company's expected earnings growth (or decline). This then helps them determine if the stock is placed for a bright or bleak future. If you're wondering about Serco Group's's valuation, check out this gauge of its price-to-earnings ratio, as compared to its industry.
Is Serco Group Making Efficient Use Of Its Profits?
Serco Group has a really low three-year median payout ratio of 13%, meaning that it has the remaining 87% left over to reinvest into its business. This suggests that the management is reinvesting most of the profits to grow the business as evidenced by the growth seen by the company.
Moreover, Serco Group is determined to keep sharing its profits with shareholders which we infer from its long history of paying a dividend for at least ten years. Our latest analyst data shows that the future payout ratio of the company is expected to rise to 27% over the next three years. Accordingly, the expected increase in the payout ratio explains the expected decline in the company's ROE to 15%, over the same period.
Conclusion
In total, we are pretty happy with Serco Group's performance. Particularly, we like that the company is reinvesting heavily into its business, and at a high rate of return. Unsurprisingly, this has led to an impressive earnings growth. With that said, on studying the latest analyst forecasts, we found that while the company has seen growth in its past earnings, analysts expect its future earnings to shrink. To know more about the latest analysts predictions for the company, check out this visualization of analyst forecasts for the company.
Have feedback on this article? Concerned about the content? Get in touch with us directly. Alternatively, email editorial-team (at) simplywallst.com.
This article by Simply Wall St is general in nature. We provide commentary based on historical data and analyst forecasts only using an unbiased methodology and our articles are not intended to be financial advice. It does not constitute a recommendation to buy or sell any stock, and does not take account of your objectives, or your financial situation. We aim to bring you long-term focused analysis driven by fundamental data. Note that our analysis may not factor in the latest price-sensitive company announcements or qualitative material. Simply Wall St has no position in any stocks mentioned.
