Is Shandong Weigao Group Medical Polymer Company Limited’s (HKG:1066) 10.0% Return On Capital Employed Good News?

Today we'll look at Shandong Weigao Group Medical Polymer Company Limited (HKG:1066) and reflect on its potential as an investment. Specifically, we'll consider its Return On Capital Employed (ROCE), since that will give us an insight into how efficiently the business can generate profits from the capital it requires.
Firstly, we'll go over how we calculate ROCE. Second, we'll look at its ROCE compared to similar companies. Then we'll determine how its current liabilities are affecting its ROCE.
What is Return On Capital Employed (ROCE)?
ROCE is a metric for evaluating how much pre-tax income (in percentage terms) a company earns on the capital invested in its business. Generally speaking a higher ROCE is better. Overall, it is a valuable metric that has its flaws. Author Edwin Whiting says to be careful when comparing the ROCE of different businesses, since 'No two businesses are exactly alike.
How Do You Calculate Return On Capital Employed?
Analysts use this formula to calculate return on capital employed:
Return on Capital Employed = Earnings Before Interest and Tax (EBIT) ÷ (Total Assets - Current Liabilities)
Or for Shandong Weigao Group Medical Polymer:
0.10 = CN¥2.1b ÷ (CN¥25b - CN¥3.9b) (Based on the trailing twelve months to June 2019.)
So, Shandong Weigao Group Medical Polymer has an ROCE of 10.0%.
See our latest analysis for Shandong Weigao Group Medical Polymer
Is Shandong Weigao Group Medical Polymer's ROCE Good?
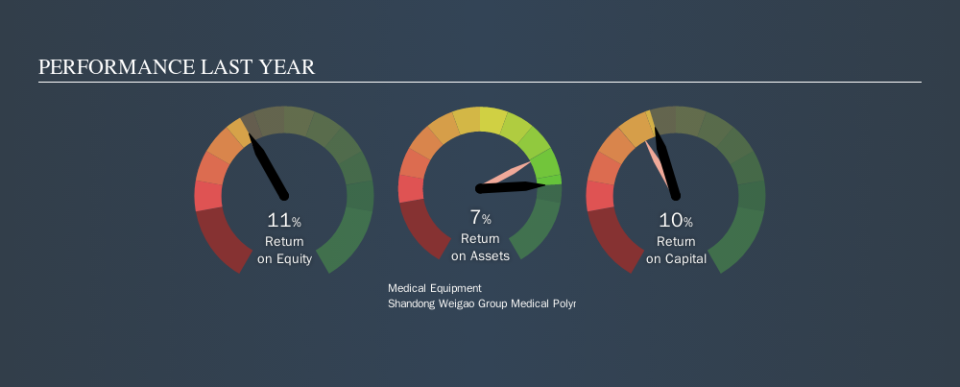
One way to assess ROCE is to compare similar companies. Using our data, Shandong Weigao Group Medical Polymer's ROCE appears to be around the 11% average of the Medical Equipment industry. Setting aside the industry comparison for now, Shandong Weigao Group Medical Polymer's ROCE is mediocre in absolute terms, considering the risk of investing in stocks versus the safety of a bank account. Readers may find more attractive investment prospects elsewhere.
You can see in the image below how Shandong Weigao Group Medical Polymer's ROCE compares to its industry. Click to see more on past growth.
When considering ROCE, bear in mind that it reflects the past and does not necessarily predict the future. Companies in cyclical industries can be difficult to understand using ROCE, as returns typically look high during boom times, and low during busts. This is because ROCE only looks at one year, instead of considering returns across a whole cycle. What happens in the future is pretty important for investors, so we have prepared a free report on analyst forecasts for Shandong Weigao Group Medical Polymer.
Do Shandong Weigao Group Medical Polymer's Current Liabilities Skew Its ROCE?
Current liabilities are short term bills and invoices that need to be paid in 12 months or less. Due to the way ROCE is calculated, a high level of current liabilities makes a company look as though it has less capital employed, and thus can (sometimes unfairly) boost the ROCE. To counter this, investors can check if a company has high current liabilities relative to total assets.
Shandong Weigao Group Medical Polymer has total assets of CN¥25b and current liabilities of CN¥3.9b. As a result, its current liabilities are equal to approximately 16% of its total assets. This is a modest level of current liabilities, which would only have a small effect on ROCE.
The Bottom Line On Shandong Weigao Group Medical Polymer's ROCE
That said, Shandong Weigao Group Medical Polymer's ROCE is mediocre, there may be more attractive investments around. Of course, you might also be able to find a better stock than Shandong Weigao Group Medical Polymer. So you may wish to see this free collection of other companies that have grown earnings strongly.
For those who like to find winning investments this free list of growing companies with recent insider purchasing, could be just the ticket.
We aim to bring you long-term focused research analysis driven by fundamental data. Note that our analysis may not factor in the latest price-sensitive company announcements or qualitative material.
If you spot an error that warrants correction, please contact the editor at editorial-team@simplywallst.com. This article by Simply Wall St is general in nature. It does not constitute a recommendation to buy or sell any stock, and does not take account of your objectives, or your financial situation. Simply Wall St has no position in the stocks mentioned. Thank you for reading.
