Shareholders in Paul Hartmann (FRA:PHH2) are in the red if they invested three years ago
For many investors, the main point of stock picking is to generate higher returns than the overall market. But in any portfolio, there are likely to be some stocks that fall short of that benchmark. Unfortunately, that's been the case for longer term Paul Hartmann AG (FRA:PHH2) shareholders, since the share price is down 44% in the last three years, falling well short of the market decline of around 4.3%.
With that in mind, it's worth seeing if the company's underlying fundamentals have been the driver of long term performance, or if there are some discrepancies.
See our latest analysis for Paul Hartmann
There is no denying that markets are sometimes efficient, but prices do not always reflect underlying business performance. One way to examine how market sentiment has changed over time is to look at the interaction between a company's share price and its earnings per share (EPS).
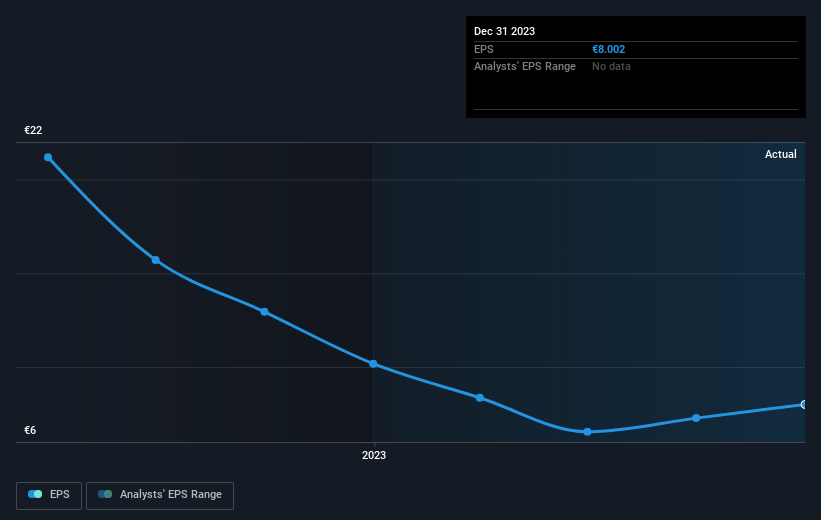
Paul Hartmann saw its EPS decline at a compound rate of 36% per year, over the last three years. This fall in the EPS is worse than the 18% compound annual share price fall. So, despite the prior disappointment, shareholders must have some confidence the situation will improve, longer term.
The image below shows how EPS has tracked over time (if you click on the image you can see greater detail).
It might be well worthwhile taking a look at our free report on Paul Hartmann's earnings, revenue and cash flow.
What About Dividends?
It is important to consider the total shareholder return, as well as the share price return, for any given stock. Whereas the share price return only reflects the change in the share price, the TSR includes the value of dividends (assuming they were reinvested) and the benefit of any discounted capital raising or spin-off. Arguably, the TSR gives a more comprehensive picture of the return generated by a stock. We note that for Paul Hartmann the TSR over the last 3 years was -39%, which is better than the share price return mentioned above. This is largely a result of its dividend payments!
A Different Perspective
Paul Hartmann provided a TSR of 2.6% over the last twelve months. Unfortunately this falls short of the market return. On the bright side, that's still a gain, and it is certainly better than the yearly loss of about 5% endured over half a decade. So this might be a sign the business has turned its fortunes around. I find it very interesting to look at share price over the long term as a proxy for business performance. But to truly gain insight, we need to consider other information, too. To that end, you should learn about the 2 warning signs we've spotted with Paul Hartmann (including 1 which is significant) .
We will like Paul Hartmann better if we see some big insider buys. While we wait, check out this free list of growing companies with considerable, recent, insider buying.
Please note, the market returns quoted in this article reflect the market weighted average returns of stocks that currently trade on German exchanges.
Have feedback on this article? Concerned about the content? Get in touch with us directly. Alternatively, email editorial-team (at) simplywallst.com.
This article by Simply Wall St is general in nature. We provide commentary based on historical data and analyst forecasts only using an unbiased methodology and our articles are not intended to be financial advice. It does not constitute a recommendation to buy or sell any stock, and does not take account of your objectives, or your financial situation. We aim to bring you long-term focused analysis driven by fundamental data. Note that our analysis may not factor in the latest price-sensitive company announcements or qualitative material. Simply Wall St has no position in any stocks mentioned.
