How have shipping shares performed versus broader stock market?

Ocean shipping stocks are not “buy-and-hold” investments. Shipping is a highly cyclical industry; the stocks require market timing. Non-insiders who hold shipping stocks for long periods are generally either “buy-and-wait” investors waiting for a cyclical upturn to pay off or “bag holders” who didn’t sell when the cycle turned down and are sitting on their losses.
How have shipping stocks fared so far this year, and how have they done over the longer term?
FreightWaves compared price changes for a selection of shipping stocks to a common buy-and-hold option: the SPDR S&P 500 ETF (NYSE: SPY), a leading exchange-traded fund that’s a proxy for the broader stock market.
Price changes using data from Koyfin (which adjusts prices for dividend payments) were tracked across various shipping sectors both year to date (YTD) and over the past four years, a timeframe that compares pre-COVID stock levels to current levels.
The comparisons show that several shipping stocks have performed better than SPY in both the shorter and longer terms.
Container shipping stocks
The pattern for many shipping equities this year has been: up in January and February, down in March-June, then a divergence this summer, with some rebounding and others not.
Container shipping stocks have done surprisingly well given the gloomy sector outlook. The stock of niche ocean carrier Matson (NYSE: MATX) tops this sector’s ranking. Matson shares have been on the upswing since April and have risen more than twice as much as SPY. Matson was up 41% through Thursday’s close versus SPY’s 18% YTD rise.
Container-ship lessor Danaos Corp (NYSE: DAC) has also outperformed the broader market indicator, up 27%.
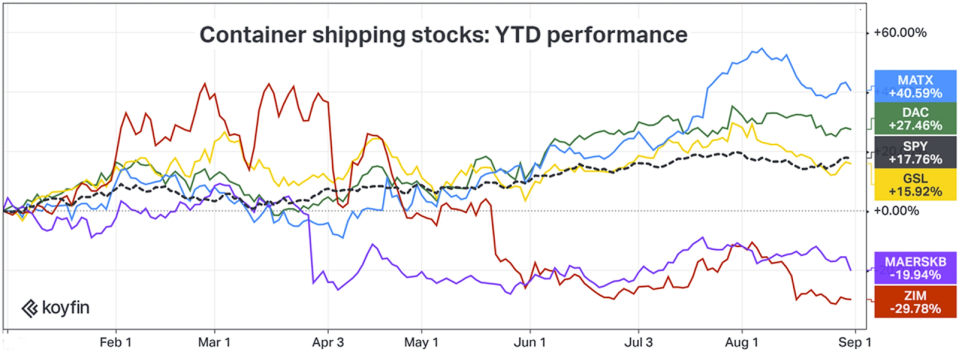
At the bottom of the spectrum are ocean carriers Maersk (Copenhagen: MAERSKB) and Zim (NYSE: ZIM), down 20% and 30% YTD, respectively, adjusted for dividends. These stocks began falling this year in March and have not recovered, far underperforming SPY.
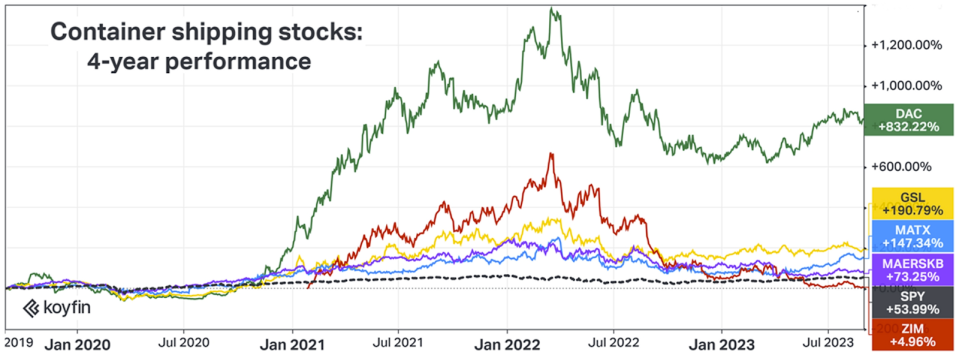
Most container shipping stocks are still topping the S&P 500 ETF on a four-year basis despite the fact that the market peaked last year after pandemic effects wound down. Danaos is up 832% from August 2019, according to Koyfin data. Shares owned by the company’s sponsor, John Coustas, are currently worth $604 million.
Tanker stocks
Tanker stocks regained some of their forward momentum this summer, rising through July and the first half of August, then given back a portion of their gains toward the end of last month.
Overseas Shipping Group (NYSE: OSG) — which leads the pack — has not followed the typical tanker-stock price pattern. Its shares have steadily risen throughout the year; it’s up 52% YTD. OSG focuses on the Jones Act (U.S. coastwise) trade, a completely different market than other listed tanker names.
The other tanker stocks that have beaten SPY — Frontline (NYSE: FRO), Teekay Tankers (NYSE: TNK) and Nordic American Tankers (NYSE: NAT) — are up 45%, 32% and 28% YTD, respectively. All three have exposure to the midsize crude-tanker sector.
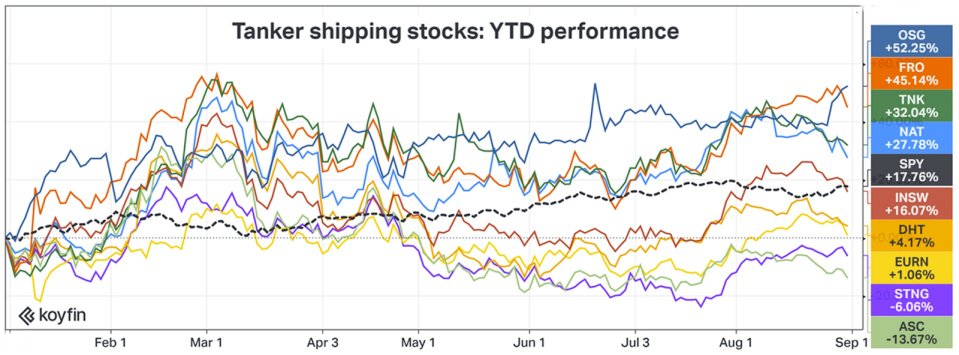
Numerous tanker stocks have done worse than SPY in 2023. Product tanker stocks are at the bottom. The adjusted share price of Scorpio Tankers (NYSE: STNG) was down 6% YTD through Thursday, with Admore Shipping (NYSE: ASC) down 14%.
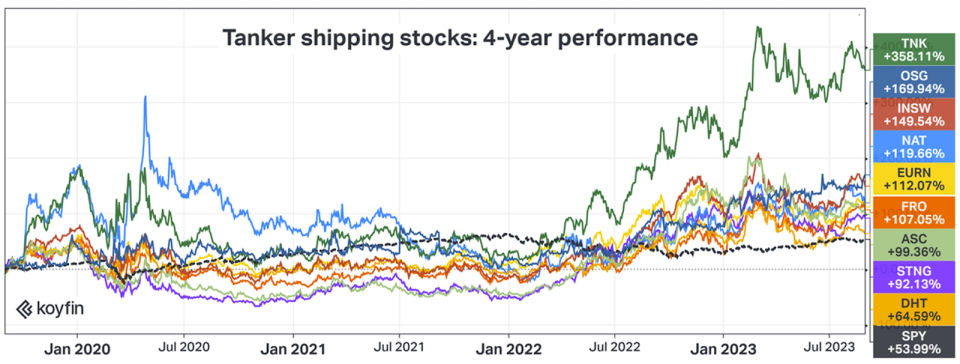
Looking at the longer-term view, the top tanker names have all outperformed the S&P 500 ETF on a four-year basis.
Tanker equities did much worse than the broader stock market in the second half of 2020 through the first half of 2022 as a result of COVID demand fallout, but have more than made up for lost ground since then.
Teekay Tanker’s adjusted price is up 358% since late August 2019, according to Koyfin data.
Gas shipping stocks
Gas shipping stocks fall in two groups: shares of owners of specialized tankers carrying pressurized liquefied petroleum gas (LPG) — propane and butane — and shares of owners of specialized tankers carrying supercooled liquefied natural gas (LNG).
LPG shipping stocks have been star performers in both the short and long terms, led by companies that own very large gas carriers (VLGCs), vessels that serve high-volume, long-haul LPG trades. Panama Canal congestion is now adding to VLGC upside, creating supply-side ineffiencies that support spot rates.

The adjusted share price of Avance Gas (Oslo: AGAS) was up 79% YTD through Thursday, more than four times SPY’s gains. Shares of BW LPG (Oslo: BWLG) were up 70% and those of Dorian LPG (NYSE: LPG) were up 36%.
Most of the previously listed LNG carrier owners have been taken private. One of the remaining pure LNG carrier owners is Flex LNG (NYSE: FLNG). Another is CoolCo, which was not included in the survey due to the recency of its listing. Flex LNG’s stock has been relatively flat this year, down 7% as of Thursday.
Looking at gas-shipping stock performance over a four-year timeframe, Flex LNG is second best, after Avance. Gas carrier stocks have performed three to four times as well as the broader stock-market benchmark since late August 2019, with the exception of Navigator Gas (NYSE: NVGS), which specializes in smaller LPG carriers and has been roughly on par with SPY.

Dry bulk stocks
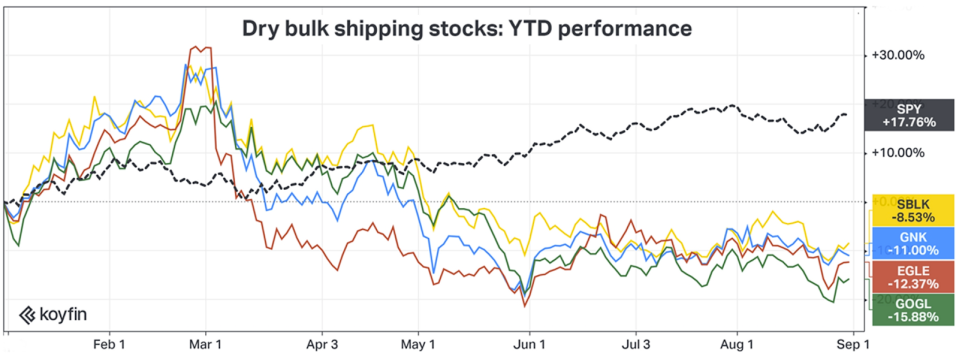
The dry bulk stocks have been the laggards in public shipping markets this year.
Dry bulk shipping rates are heavily exposed to the Chinese economy. News out of China continues to worsen. Listed dry bulk stocks have been falling since March — and they’re still falling.
The adjusted share price of Golden Ocean (NASDAQ: GOGL) has declined the most, down 16% YTD, according to Koyfin data. Eagle Bulk (NYSE: EGLE) is down 12%, Genco Shipping and Trading (NYSE: GNK) 11% and Star Bulk (NYSE: SBLK) 9%.
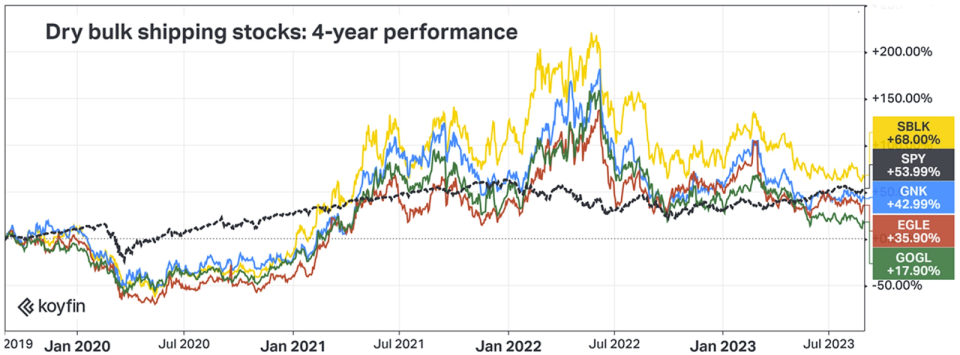
The longer-term chart for dry bulk stocks highlights the importance of market timing.
Port restrictions in China tied up dry bulk shipping capacity in congestion during the pandemic, pushing up rates. Dry bulk stocks enjoyed a huge run-up between early 2021 and mid-2022. However, as a result of declines in the second half of last year and 2023 YTD, most dry bulk names are now underperforming SPY on a four-year basis.
Looking even longer term
The fact that several shipping stocks have done better than the broader stock-market measure between the end of August 2019 and Thursday doesn’t imply they’re buy-and-hold investment material. It merely relates to where various shipping segments were in their respective cycles four years ago versus where they are today.
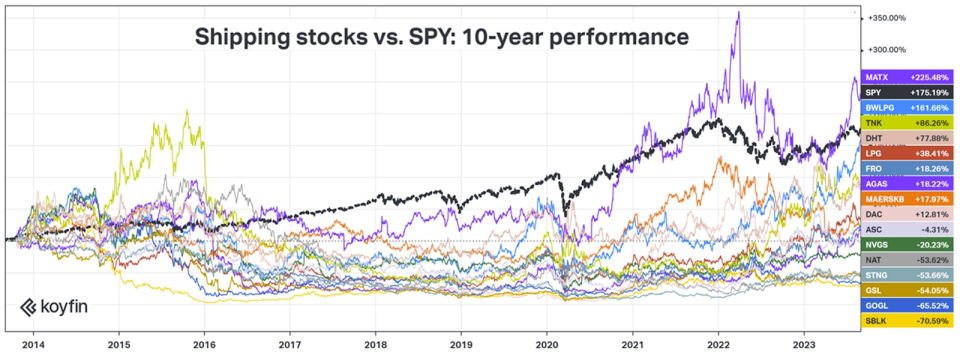
Looking even longer term, at a 10-year time horizon, SPY has risen at more than twice the pace of almost all shipping stocks.
There are two outliers: BW LPG’s adjusted share price increased 162% over the past 10 years, almost matching SPY’s gain of 175%. And Matson’s adjusted price is up 225% since late August 2013, making it the only shipping stock to outpace the SPDR S&P 500 index ETF across the span of a decade.
Click for more articles by Greg Miller
Related articles:
Corporate governance in shipping: Who’s been naughty or nice?
Controversy swirls over shipping stocks that sink as rates rise
New way to place your bets on boom and bust of shipping cycle
Shipping stock sell-off: Shares down double digits since March
Hello, goodbye: Shipping’s latest entries and exits on Wall Street
Five years on Wall Street: Shipping’s exits, arrivals, whales and minnows
Shipping’s Wall Street saga: Rags to riches to rags to occasional riches
The post How have shipping shares performed versus broader stock market? appeared first on FreightWaves.
