Shoe Carnival, Inc. (NASDAQ:SCVL) Stock Has Shown Weakness Lately But Financials Look Strong: Should Prospective Shareholders Make The Leap?
Shoe Carnival (NASDAQ:SCVL) has had a rough three months with its share price down 18%. But if you pay close attention, you might gather that its strong financials could mean that the stock could potentially see an increase in value in the long-term, given how markets usually reward companies with good financial health. In this article, we decided to focus on Shoe Carnival's ROE.
Return on equity or ROE is an important factor to be considered by a shareholder because it tells them how effectively their capital is being reinvested. Put another way, it reveals the company's success at turning shareholder investments into profits.
See our latest analysis for Shoe Carnival
How Do You Calculate Return On Equity?
ROE can be calculated by using the formula:
Return on Equity = Net Profit (from continuing operations) ÷ Shareholders' Equity
So, based on the above formula, the ROE for Shoe Carnival is:
21% = US$110m ÷ US$526m (Based on the trailing twelve months to January 2023).
The 'return' is the yearly profit. Another way to think of that is that for every $1 worth of equity, the company was able to earn $0.21 in profit.
What Is The Relationship Between ROE And Earnings Growth?
We have already established that ROE serves as an efficient profit-generating gauge for a company's future earnings. Based on how much of its profits the company chooses to reinvest or "retain", we are then able to evaluate a company's future ability to generate profits. Assuming all else is equal, companies that have both a higher return on equity and higher profit retention are usually the ones that have a higher growth rate when compared to companies that don't have the same features.
Shoe Carnival's Earnings Growth And 21% ROE
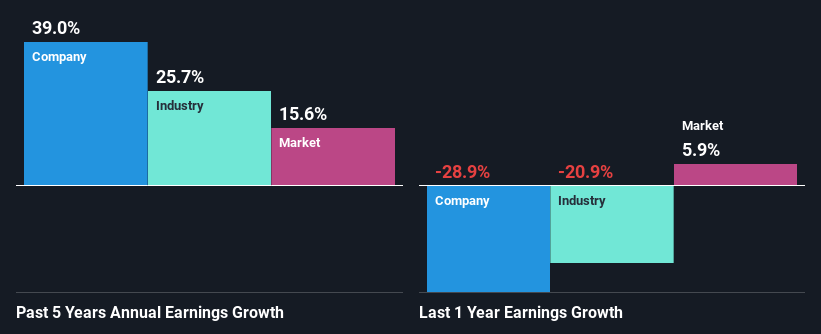
To begin with, Shoe Carnival seems to have a respectable ROE. Even when compared to the industry average of 21% the company's ROE looks quite decent. This certainly adds some context to Shoe Carnival's exceptional 39% net income growth seen over the past five years. We reckon that there could also be other factors at play here. For instance, the company has a low payout ratio or is being managed efficiently.
We then compared Shoe Carnival's net income growth with the industry and we're pleased to see that the company's growth figure is higher when compared with the industry which has a growth rate of 26% in the same period.
Earnings growth is a huge factor in stock valuation. The investor should try to establish if the expected growth or decline in earnings, whichever the case may be, is priced in. This then helps them determine if the stock is placed for a bright or bleak future. One good indicator of expected earnings growth is the P/E ratio which determines the price the market is willing to pay for a stock based on its earnings prospects. So, you may want to check if Shoe Carnival is trading on a high P/E or a low P/E, relative to its industry.
Is Shoe Carnival Using Its Retained Earnings Effectively?
Shoe Carnival has a really low three-year median payout ratio of 8.7%, meaning that it has the remaining 91% left over to reinvest into its business. This suggests that the management is reinvesting most of the profits to grow the business as evidenced by the growth seen by the company.
Additionally, Shoe Carnival has paid dividends over a period of at least ten years which means that the company is pretty serious about sharing its profits with shareholders.
Conclusion
In total, we are pretty happy with Shoe Carnival's performance. Particularly, we like that the company is reinvesting heavily into its business, and at a high rate of return. Unsurprisingly, this has led to an impressive earnings growth. That being so, a study of the latest analyst forecasts show that the company is expected to see a slowdown in its future earnings growth. To know more about the latest analysts predictions for the company, check out this visualization of analyst forecasts for the company.
Have feedback on this article? Concerned about the content? Get in touch with us directly. Alternatively, email editorial-team (at) simplywallst.com.
This article by Simply Wall St is general in nature. We provide commentary based on historical data and analyst forecasts only using an unbiased methodology and our articles are not intended to be financial advice. It does not constitute a recommendation to buy or sell any stock, and does not take account of your objectives, or your financial situation. We aim to bring you long-term focused analysis driven by fundamental data. Note that our analysis may not factor in the latest price-sensitive company announcements or qualitative material. Simply Wall St has no position in any stocks mentioned.
Join A Paid User Research Session
You’ll receive a US$30 Amazon Gift card for 1 hour of your time while helping us build better investing tools for the individual investors like yourself. Sign up here
