The Shyft Group, Inc. (NASDAQ:SHYF) Stock Is Going Strong But Fundamentals Look Uncertain: What Lies Ahead ?
Shyft Group (NASDAQ:SHYF) has had a great run on the share market with its stock up by a significant 8.7% over the last week. But the company's key financial indicators appear to be differing across the board and that makes us question whether or not the company's current share price momentum can be maintained. Specifically, we decided to study Shyft Group's ROE in this article.
Return on equity or ROE is a key measure used to assess how efficiently a company's management is utilizing the company's capital. In short, ROE shows the profit each dollar generates with respect to its shareholder investments.
See our latest analysis for Shyft Group
How To Calculate Return On Equity?
Return on equity can be calculated by using the formula:
Return on Equity = Net Profit (from continuing operations) ÷ Shareholders' Equity
So, based on the above formula, the ROE for Shyft Group is:
2.6% = US$6.5m ÷ US$252m (Based on the trailing twelve months to December 2023).
The 'return' is the income the business earned over the last year. Another way to think of that is that for every $1 worth of equity, the company was able to earn $0.03 in profit.
Why Is ROE Important For Earnings Growth?
We have already established that ROE serves as an efficient profit-generating gauge for a company's future earnings. Depending on how much of these profits the company reinvests or "retains", and how effectively it does so, we are then able to assess a company’s earnings growth potential. Generally speaking, other things being equal, firms with a high return on equity and profit retention, have a higher growth rate than firms that don’t share these attributes.
A Side By Side comparison of Shyft Group's Earnings Growth And 2.6% ROE
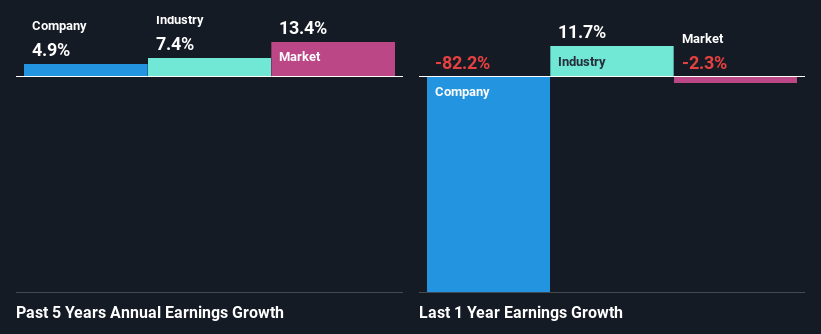
It is quite clear that Shyft Group's ROE is rather low. Even compared to the average industry ROE of 12%, the company's ROE is quite dismal. Thus, the low net income growth of 4.9% seen by Shyft Group over the past five years could probably be the result of it having a lower ROE.
We then compared Shyft Group's net income growth with the industry and found that the company's growth figure is lower than the average industry growth rate of 7.4% in the same 5-year period, which is a bit concerning.
The basis for attaching value to a company is, to a great extent, tied to its earnings growth. What investors need to determine next is if the expected earnings growth, or the lack of it, is already built into the share price. Doing so will help them establish if the stock's future looks promising or ominous. What is SHYF worth today? The intrinsic value infographic in our free research report helps visualize whether SHYF is currently mispriced by the market.
Is Shyft Group Using Its Retained Earnings Effectively?
Shyft Group's low three-year median payout ratio of 12% (or a retention ratio of 88%) should mean that the company is retaining most of its earnings to fuel its growth. However, the low earnings growth number doesn't reflect this fact. So there could be some other explanation in that regard. For instance, the company's business may be deteriorating.
Additionally, Shyft Group has paid dividends over a period of at least ten years, which means that the company's management is determined to pay dividends even if it means little to no earnings growth.
Summary
On the whole, we feel that the performance shown by Shyft Group can be open to many interpretations. While the company does have a high rate of profit retention, its low rate of return is probably hampering its earnings growth. Having said that, looking at the current analyst estimates, we found that the company's earnings are expected to gain momentum. To know more about the latest analysts predictions for the company, check out this visualization of analyst forecasts for the company.
Have feedback on this article? Concerned about the content? Get in touch with us directly. Alternatively, email editorial-team (at) simplywallst.com.
This article by Simply Wall St is general in nature. We provide commentary based on historical data and analyst forecasts only using an unbiased methodology and our articles are not intended to be financial advice. It does not constitute a recommendation to buy or sell any stock, and does not take account of your objectives, or your financial situation. We aim to bring you long-term focused analysis driven by fundamental data. Note that our analysis may not factor in the latest price-sensitive company announcements or qualitative material. Simply Wall St has no position in any stocks mentioned.
