Silgan (SLGN) Misses Q2 Earnings Estimates, Lowers 2023 View
Silgan Holdings Inc. SLGN reported adjusted earnings of 83 cents per share in second-quarter 2023, which missed the Zacks Consensus Estimate of adjusted earnings of 91 cents per share. The bottom line declined 24% year over year and lagged the company’s guidance of 85-95 cents per share.
Including one-time items, earnings were 71 cents per share, compared with 83 cents per share reported in the prior-year quarter.
Total revenues decreased 8% year over year to $1,427 million from the prior-year quarter’s $1,544 million. The top line missed the Zacks Consensus Estimate of $1,538 million. Low volumes impacted sales in the quarter.
Silgan Holdings Inc. Price, Consensus and EPS Surprise
Silgan Holdings Inc. price-consensus-eps-surprise-chart | Silgan Holdings Inc. Quote
Costs and Margins
In second-quarter 2023, the cost of goods sold decreased 7% year over year to $1,177 million. The gross profit decreased 8.7% to $250 million. The gross margin was 17.5%, compared with the prior-year quarter’s 17.7%.
Selling, general and administrative expenses were $102 million in the reported quarter, compared with the year-ago quarter’s $127 million. The company reported an operating income of $144 million in the quarter, compared with $158 million in the prior-year quarter.
Adjusted operating profit was $160.8 million in the second quarter of 2023, which was 14.4% lower than $187.8 million in the last year’s quarter. The adjusted operating margin was 11.3% in the reported quarter, compared with the prior-year quarter’s 12.2%.
Segmental Performances
Revenues in the Dispensing and Specialty Closures segment were down 7% year over year to $560 million in the second quarter. The figure came in lower than the Zacks Consensus Estimate of $592.6 million due to lower volume and mix. Inflated single-digit volume growth in higher value dispensing products were offset by doubl-digit declines in higher volume closures for food and beverage markets. Lower food and beverage closures volumes in Europe mainly dragged volumes in the quarter.
The operating income for the segment was $63.7 million in the second quarter of 2023, compared with $91.3 million in second-quarter 2022. The figure lagged the Zacks Consensus Estimate of $101 million. Labor challenges, which impacted output at a food and beverage closures facility in the United States, led to higher costs in the quarter. The segment’s adjusted operating income was $77 million, compared with $100 million in the prior-year period.
The Metal Containers segment’s revenues in the quarter declined 6% year over year to $711 million due to lower volumes. Soup volumes returned to a more normal seasonal pattern while pet food volumes continued to be strong. Revenues in the quarter fell short of the Zacks Consensus Estimate of $1,154 million.
The segment’s operating income in the quarter under review was $73.6 million, up 11% from the last year’s quarter on favorable price/cost that offset the impact of lower volumes. However, it came in lower than the consensus estimate of $118.3 million. Adjusted operating income for the segment amounted to $76 million, up 19% from the prior-year quarter.
In the Custom Containers segment, revenues were $156 million, compared with the year-ago quarter’s $187 million. The figure was also lower than the Zacks Consensus Estimate of $176 million. Operating income slumped 45% year over year to $17 million and came in lower than the consensus estimate of $23.3 million. The segment reported an adjusted operating income of $18.5 million, down from the previous year’s $30 million.
Financial Updates
The company had cash and cash equivalents of $237 million at the end of the first quarter of 2023, compared with $586 million at the end of 2022. The company used around $812 million in cash from operating activities in the first six-month period of 2023, compared with an outflow of $352 million in the last year’s comparable period.
2023 Outlook
Silgan expects 2023 adjusted earnings per share (EPS) between $3.40 and $3.60, lower than its previous expectation in the range of $3.95 to $4.15.
For third-quarter 2023, Silgan anticipates adjusted EPS in the range of $1.10-$1.20. The company reported earnings of $1.28 per share in third-quarter 2022.
Price Performance
Silgan’s shares have gained 11.2% in the past year against the industry’s fall of 9.8%.
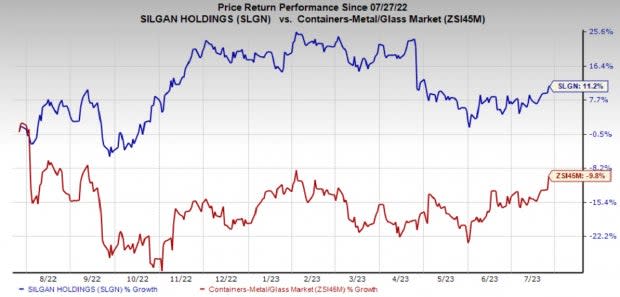
Image Source: Zacks Investment Research
Zacks Rank and Stocks to Consider
Silgan currently carries a Zacks Rank #3 (Hold).
Some better-ranked stocks from the Industrial Products sector are Worthington Industries, Inc. WOR, The Manitowoc Company, Inc. MTW and W.W. Grainger, Inc. GWW. WOR and MTW sport a Zacks Rank #1 (Strong Buy) at present, and GWW has a Zacks Rank #2 (Buy). You can see the complete list of today’s Zacks #1 Rank stocks here.
Worthington Industries has an average trailing four-quarter earnings surprise of 14.9%. The Zacks Consensus Estimate for WOR’s fiscal 2023 earnings is pegged at $5.65 per share. The consensus estimate for 2023 earnings has moved 22.6% north in the past 60 days. Its shares have gained 58% in the last year.
Manitowoc has an average trailing four-quarter earnings surprise of 256.3%. The Zacks Consensus Estimate for MTW’s 2023 earnings is pegged at $1.12 per share. The consensus estimate for 2023 earnings has moved 7.8% north in the past 60 days. MTW’s shares have gained 68% in the last year.
The Zacks Consensus Estimate for Grainger’s 2023 earnings per share is pegged at $35.86, up 1% in the past 60 days. It has a trailing four-quarter average earnings surprise of 9.1%. GWW has gained 59% in the last year.
Want the latest recommendations from Zacks Investment Research? Today, you can download 7 Best Stocks for the Next 30 Days. Click to get this free report
The Manitowoc Company, Inc. (MTW) : Free Stock Analysis Report
Worthington Industries, Inc. (WOR) : Free Stock Analysis Report
Silgan Holdings Inc. (SLGN) : Free Stock Analysis Report
W.W. Grainger, Inc. (GWW) : Free Stock Analysis Report
