Is Silicon Laboratories (SLAB) Too Good to Be True? A Comprehensive Analysis of a Potential ...
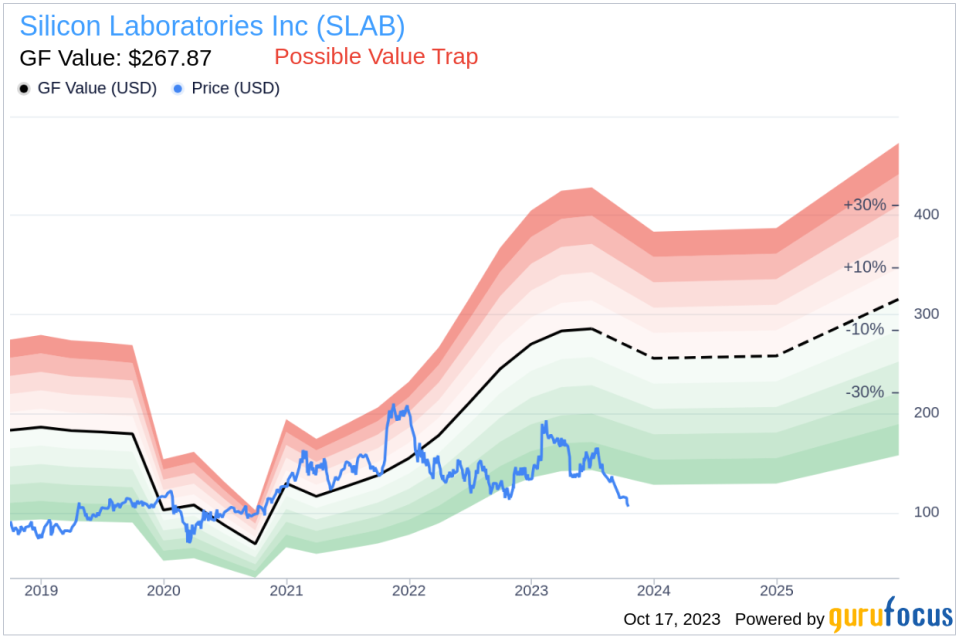
Value-focused investors are always on the hunt for stocks that are priced below their intrinsic value. One such stock that merits attention is Silicon Laboratories Inc (NASDAQ:SLAB). The stock, which is currently priced at $105.92, recorded a loss of 4.42% in a day and a 3-month decrease of 36.03%. The stock's fair valuation is $267.87, as indicated by its GF Value.
Understanding GF Value
The GF Value represents the current intrinsic value of a stock derived from our exclusive method. The GF Value Line on our summary page gives an overview of the fair value that the stock should be traded at. It is calculated based on historical multiples (PE Ratio, PS Ratio, PB Ratio, and Price-to-Free-Cash-Flow) that the stock has traded at, GuruFocus adjustment factor based on the company's past returns and growth, and future estimates of the business performance.
The Potential Risks
However, investors need to consider a more in-depth analysis before making an investment decision. Despite its seemingly attractive valuation, certain risk factors associated with Silicon Laboratories should not be ignored. These risks are primarily reflected through its low Piotroski F-score and a Beneish M-Score of -1.53 that exceeds -1.78, the threshold for potential earnings manipulation. These indicators suggest that Silicon Laboratories, despite its apparent undervaluation, might be a potential value trap. This complexity underlines the importance of thorough due diligence in investment decision-making.
Decoding Beneish M-Score
Developed by Professor Messod Beneish, the Beneish M-Score is based on eight financial variables that reflect different aspects of a company's financial performance and position. These are Days Sales Outstanding (DSO), Gross Margin (GM), Total Long-term Assets Less Property, Plant and Equipment over Total Assets (TATA), change in Revenue (?REV), change in Depreciation and Amortization (?DA), change in Selling, General and Admin expenses (?SGA), change in Debt-to-Asset Ratio (?LVG), and Net Income Less Non-Operating Income and Cash Flow from Operations over Total Assets (?NOATA).
Company Snapshot
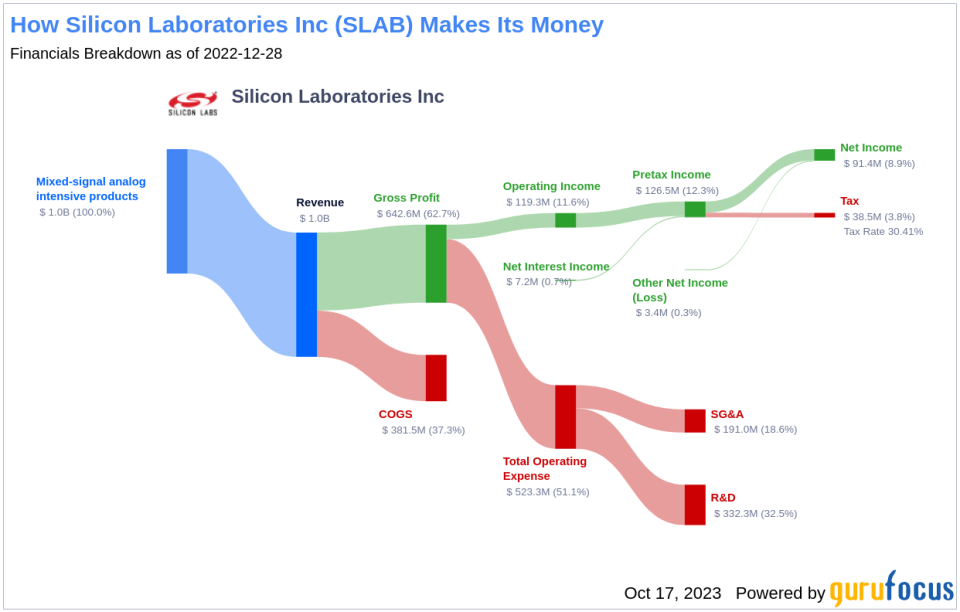
Silicon Laboratories Inc develops semiconductors, software, and system solutions for the "Internet of Things," Internet infrastructure, industrial control, consumer, and automotive markets. The company operates through one segment, mixed-signal analog intensive products, consisting of diverse product areas, which the company groups into four categories: Internet of Things, broadcast, infrastructure and access. The Internet of Things category is the largest contributor to the company's total revenue.
Gross Margin: A Key Indicator
The Gross Margin index tracks the evolution of a company's gross profit as a proportion of its revenue. A downward trend could indicate issues such as overproduction or more generous credit terms, both of which are potential red flags for earnings manipulation. By examining the past three years of Silicon Laboratories's historical data (2021: 57.35; 2022: 62.55; 2023: 60.91), we find that its Gross Margin has contracted by 3.82%. Such a contraction in the gross margin can negatively impact the company's profitability as it signifies lesser income from each dollar of sales. This could put a strain on the company's capacity to manage operating costs, potentially undermining its financial stability.
Understanding TATA Ratio
The TATA (Total Accruals to Total Assets) ratio, calculated as the Net Income less Non-Operating Income and Cash Flow from Operations, divided by Total Assets, is a key indicator of the quality of a company's earnings. For Silicon Laboratories, the current TATA ratio (TTM) stands at 0.039. A positive TATA ratio can be a warning sign, suggesting that the earnings are composed more of accruals rather than cash flow, which could be an indication of aggressive income recognition.
Conclusion
Considering the above factors, it is clear that while Silicon Laboratories Inc (NASDAQ:SLAB) presents an attractive valuation, potential risk factors cannot be ignored. The low Piotroski F-score, high Beneish M-Score, and the positive TATA ratio suggest that the company might be a potential value trap. Therefore, investors are advised to conduct thorough due diligence before making an investment decision.
To find out the high quality companies that may deliver above-average returns, please check out GuruFocus High Quality Low Capex Screener.
This article, generated by GuruFocus, is designed to provide general insights and is not tailored financial advice. Our commentary is rooted in historical data and analyst projections, utilizing an impartial methodology, and is not intended to serve as specific investment guidance. It does not formulate a recommendation to purchase or divest any stock and does not consider individual investment objectives or financial circumstances. Our objective is to deliver long-term, fundamental data-driven analysis. Be aware that our analysis might not incorporate the most recent, price-sensitive company announcements or qualitative information. GuruFocus holds no position in the stocks mentioned herein.
This article first appeared on GuruFocus.
