As Simmons First National (NASDAQ:SFNC) spikes 10% this past week, investors may now be noticing the company's five-year earnings growth
While it may not be enough for some shareholders, we think it is good to see the Simmons First National Corporation (NASDAQ:SFNC) share price up 17% in a single quarter. But over the last half decade, the stock has not performed well. After all, the share price is down 35% in that time, significantly under-performing the market.
On a more encouraging note the company has added US$236m to its market cap in just the last 7 days, so let's see if we can determine what's driven the five-year loss for shareholders.
Check out our latest analysis for Simmons First National
While the efficient markets hypothesis continues to be taught by some, it has been proven that markets are over-reactive dynamic systems, and investors are not always rational. One way to examine how market sentiment has changed over time is to look at the interaction between a company's share price and its earnings per share (EPS).
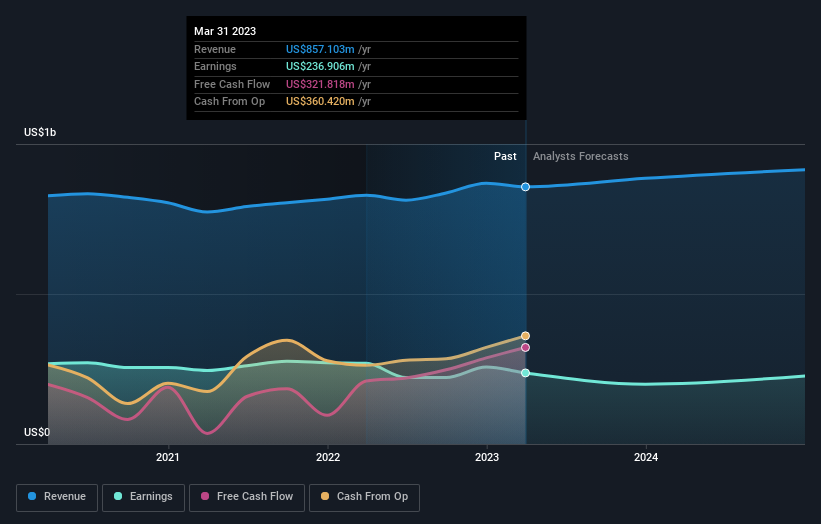
While the share price declined over five years, Simmons First National actually managed to increase EPS by an average of 3.2% per year. So it doesn't seem like EPS is a great guide to understanding how the market is valuing the stock. Alternatively, growth expectations may have been unreasonable in the past.
Based on these numbers, we'd venture that the market may have been over-optimistic about forecast growth, half a decade ago. Looking to other metrics might better explain the share price change.
We note that the dividend has remained healthy, so that wouldn't really explain the share price drop. It's not immediately clear to us why the stock price is down but further research might provide some answers.
You can see below how earnings and revenue have changed over time (discover the exact values by clicking on the image).
It's probably worth noting we've seen significant insider buying in the last quarter, which we consider a positive. On the other hand, we think the revenue and earnings trends are much more meaningful measures of the business. This free report showing analyst forecasts should help you form a view on Simmons First National
What About Dividends?
As well as measuring the share price return, investors should also consider the total shareholder return (TSR). The TSR incorporates the value of any spin-offs or discounted capital raisings, along with any dividends, based on the assumption that the dividends are reinvested. Arguably, the TSR gives a more comprehensive picture of the return generated by a stock. We note that for Simmons First National the TSR over the last 5 years was -24%, which is better than the share price return mentioned above. This is largely a result of its dividend payments!
A Different Perspective
Investors in Simmons First National had a tough year, with a total loss of 8.4% (including dividends), against a market gain of about 15%. However, keep in mind that even the best stocks will sometimes underperform the market over a twelve month period. Unfortunately, last year's performance may indicate unresolved challenges, given that it was worse than the annualised loss of 4% over the last half decade. We realise that Baron Rothschild has said investors should "buy when there is blood on the streets", but we caution that investors should first be sure they are buying a high quality business. While it is well worth considering the different impacts that market conditions can have on the share price, there are other factors that are even more important. Consider risks, for instance. Every company has them, and we've spotted 1 warning sign for Simmons First National you should know about.
If you like to buy stocks alongside management, then you might just love this free list of companies. (Hint: insiders have been buying them).
Please note, the market returns quoted in this article reflect the market weighted average returns of stocks that currently trade on American exchanges.
Have feedback on this article? Concerned about the content? Get in touch with us directly. Alternatively, email editorial-team (at) simplywallst.com.
This article by Simply Wall St is general in nature. We provide commentary based on historical data and analyst forecasts only using an unbiased methodology and our articles are not intended to be financial advice. It does not constitute a recommendation to buy or sell any stock, and does not take account of your objectives, or your financial situation. We aim to bring you long-term focused analysis driven by fundamental data. Note that our analysis may not factor in the latest price-sensitive company announcements or qualitative material. Simply Wall St has no position in any stocks mentioned.
Join A Paid User Research Session
You’ll receive a US$30 Amazon Gift card for 1 hour of your time while helping us build better investing tools for the individual investors like yourself. Sign up here
