Simpson Manufacturing Co., Inc.'s (NYSE:SSD) Stock Has Been Sliding But Fundamentals Look Strong: Is The Market Wrong?
With its stock down 2.2% over the past three months, it is easy to disregard Simpson Manufacturing (NYSE:SSD). However, a closer look at its sound financials might cause you to think again. Given that fundamentals usually drive long-term market outcomes, the company is worth looking at. Specifically, we decided to study Simpson Manufacturing's ROE in this article.
Return on equity or ROE is a key measure used to assess how efficiently a company's management is utilizing the company's capital. Put another way, it reveals the company's success at turning shareholder investments into profits.
View our latest analysis for Simpson Manufacturing
How Is ROE Calculated?
Return on equity can be calculated by using the formula:
Return on Equity = Net Profit (from continuing operations) ÷ Shareholders' Equity
So, based on the above formula, the ROE for Simpson Manufacturing is:
25% = US$311m ÷ US$1.2b (Based on the trailing twelve months to March 2022).
The 'return' is the profit over the last twelve months. One way to conceptualize this is that for each $1 of shareholders' capital it has, the company made $0.25 in profit.
What Is The Relationship Between ROE And Earnings Growth?
Thus far, we have learned that ROE measures how efficiently a company is generating its profits. Based on how much of its profits the company chooses to reinvest or "retain", we are then able to evaluate a company's future ability to generate profits. Assuming all else is equal, companies that have both a higher return on equity and higher profit retention are usually the ones that have a higher growth rate when compared to companies that don't have the same features.
Simpson Manufacturing's Earnings Growth And 25% ROE
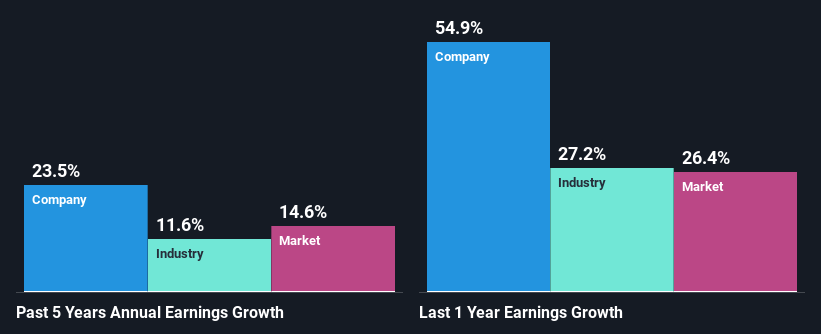
First thing first, we like that Simpson Manufacturing has an impressive ROE. Additionally, the company's ROE is higher compared to the industry average of 19% which is quite remarkable. As a result, Simpson Manufacturing's exceptional 24% net income growth seen over the past five years, doesn't come as a surprise.
We then compared Simpson Manufacturing's net income growth with the industry and we're pleased to see that the company's growth figure is higher when compared with the industry which has a growth rate of 12% in the same period.
Earnings growth is a huge factor in stock valuation. The investor should try to establish if the expected growth or decline in earnings, whichever the case may be, is priced in. Doing so will help them establish if the stock's future looks promising or ominous. Has the market priced in the future outlook for SSD? You can find out in our latest intrinsic value infographic research report.
Is Simpson Manufacturing Making Efficient Use Of Its Profits?
Simpson Manufacturing's three-year median payout ratio to shareholders is 22%, which is quite low. This implies that the company is retaining 78% of its profits. So it looks like Simpson Manufacturing is reinvesting profits heavily to grow its business, which shows in its earnings growth.
Besides, Simpson Manufacturing has been paying dividends for at least ten years or more. This shows that the company is committed to sharing profits with its shareholders.
Conclusion
On the whole, we feel that Simpson Manufacturing's performance has been quite good. Specifically, we like that the company is reinvesting a huge chunk of its profits at a high rate of return. This of course has caused the company to see substantial growth in its earnings. With that said, the latest industry analyst forecasts reveal that the company's earnings growth is expected to slow down. Are these analysts expectations based on the broad expectations for the industry, or on the company's fundamentals? Click here to be taken to our analyst's forecasts page for the company.
Have feedback on this article? Concerned about the content? Get in touch with us directly. Alternatively, email editorial-team (at) simplywallst.com.
This article by Simply Wall St is general in nature. We provide commentary based on historical data and analyst forecasts only using an unbiased methodology and our articles are not intended to be financial advice. It does not constitute a recommendation to buy or sell any stock, and does not take account of your objectives, or your financial situation. We aim to bring you long-term focused analysis driven by fundamental data. Note that our analysis may not factor in the latest price-sensitive company announcements or qualitative material. Simply Wall St has no position in any stocks mentioned.
Join A Paid User Research Session
You’ll receive a US$30 Amazon Gift card for 1 hour of your time while helping us build better investing tools for the individual investors like yourself. Sign up here
