Simulations Plus, Inc. (NASDAQ:SLP) Stock's Been Sliding But Fundamentals Look Decent: Will The Market Correct The Share Price In The Future?
It is hard to get excited after looking at Simulations Plus' (NASDAQ:SLP) recent performance, when its stock has declined 6.6% over the past month. However, the company's fundamentals look pretty decent, and long-term financials are usually aligned with future market price movements. Specifically, we decided to study Simulations Plus' ROE in this article.
ROE or return on equity is a useful tool to assess how effectively a company can generate returns on the investment it received from its shareholders. Simply put, it is used to assess the profitability of a company in relation to its equity capital.
View our latest analysis for Simulations Plus
How Is ROE Calculated?
Return on equity can be calculated by using the formula:
Return on Equity = Net Profit (from continuing operations) ÷ Shareholders' Equity
So, based on the above formula, the ROE for Simulations Plus is:
6.1% = US$10m ÷ US$169m (Based on the trailing twelve months to May 2023).
The 'return' refers to a company's earnings over the last year. That means that for every $1 worth of shareholders' equity, the company generated $0.06 in profit.
What Is The Relationship Between ROE And Earnings Growth?
Thus far, we have learned that ROE measures how efficiently a company is generating its profits. We now need to evaluate how much profit the company reinvests or "retains" for future growth which then gives us an idea about the growth potential of the company. Assuming all else is equal, companies that have both a higher return on equity and higher profit retention are usually the ones that have a higher growth rate when compared to companies that don't have the same features.
A Side By Side comparison of Simulations Plus' Earnings Growth And 6.1% ROE
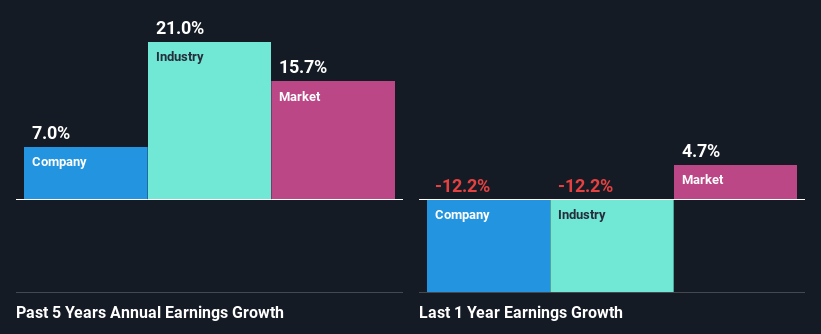
At first glance, Simulations Plus' ROE doesn't look very promising. Yet, a closer study shows that the company's ROE is similar to the industry average of 5.4%. On the other hand, Simulations Plus reported a moderate 7.0% net income growth over the past five years. Given the slightly low ROE, it is likely that there could be some other aspects that are driving this growth. Such as - high earnings retention or an efficient management in place.
Next, on comparing with the industry net income growth, we found that Simulations Plus' reported growth was lower than the industry growth of 21% over the last few years, which is not something we like to see.
Earnings growth is an important metric to consider when valuing a stock. It’s important for an investor to know whether the market has priced in the company's expected earnings growth (or decline). This then helps them determine if the stock is placed for a bright or bleak future. Is Simulations Plus fairly valued compared to other companies? These 3 valuation measures might help you decide.
Is Simulations Plus Efficiently Re-investing Its Profits?
Simulations Plus has a three-year median payout ratio of 45%, which implies that it retains the remaining 55% of its profits. This suggests that its dividend is well covered, and given the decent growth seen by the company, it looks like management is reinvesting its earnings efficiently.
Besides, Simulations Plus has been paying dividends for at least ten years or more. This shows that the company is committed to sharing profits with its shareholders.
Summary
Overall, we feel that Simulations Plus certainly does have some positive factors to consider. Namely, its respectable earnings growth, which it achieved due to it retaining most of its profits. However, given the low ROE, investors may not be benefitting from all that reinvestment after all. Having said that, looking at the current analyst estimates, we found that the company's earnings are expected to gain momentum. Are these analysts expectations based on the broad expectations for the industry, or on the company's fundamentals? Click here to be taken to our analyst's forecasts page for the company.
Have feedback on this article? Concerned about the content? Get in touch with us directly. Alternatively, email editorial-team (at) simplywallst.com.
This article by Simply Wall St is general in nature. We provide commentary based on historical data and analyst forecasts only using an unbiased methodology and our articles are not intended to be financial advice. It does not constitute a recommendation to buy or sell any stock, and does not take account of your objectives, or your financial situation. We aim to bring you long-term focused analysis driven by fundamental data. Note that our analysis may not factor in the latest price-sensitive company announcements or qualitative material. Simply Wall St has no position in any stocks mentioned.
Join A Paid User Research Session
You’ll receive a US$30 Amazon Gift card for 1 hour of your time while helping us build better investing tools for the individual investors like yourself. Sign up here
