Simulations Plus, Inc. (NASDAQ:SLP) Stock's Been Sliding But Fundamentals Look Decent: Will The Market Correct The Share Price In The Future?
With its stock down 20% over the past three months, it is easy to disregard Simulations Plus (NASDAQ:SLP). However, stock prices are usually driven by a company’s financials over the long term, which in this case look pretty respectable. Particularly, we will be paying attention to Simulations Plus' ROE today.
Return on equity or ROE is an important factor to be considered by a shareholder because it tells them how effectively their capital is being reinvested. In other words, it is a profitability ratio which measures the rate of return on the capital provided by the company's shareholders.
View our latest analysis for Simulations Plus
How Is ROE Calculated?
Return on equity can be calculated by using the formula:
Return on Equity = Net Profit (from continuing operations) ÷ Shareholders' Equity
So, based on the above formula, the ROE for Simulations Plus is:
7.1% = US$12m ÷ US$165m (Based on the trailing twelve months to May 2021).
The 'return' is the amount earned after tax over the last twelve months. So, this means that for every $1 of its shareholder's investments, the company generates a profit of $0.07.
What Is The Relationship Between ROE And Earnings Growth?
Thus far, we have learned that ROE measures how efficiently a company is generating its profits. Depending on how much of these profits the company reinvests or "retains", and how effectively it does so, we are then able to assess a company’s earnings growth potential. Assuming everything else remains unchanged, the higher the ROE and profit retention, the higher the growth rate of a company compared to companies that don't necessarily bear these characteristics.
A Side By Side comparison of Simulations Plus' Earnings Growth And 7.1% ROE
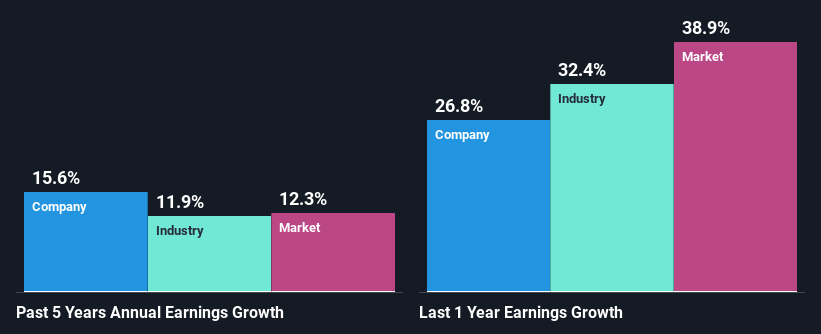
At first glance, Simulations Plus' ROE doesn't look very promising. Yet, a closer study shows that the company's ROE is similar to the industry average of 7.1%. Having said that, Simulations Plus has shown a modest net income growth of 16% over the past five years. Taking into consideration that the ROE is not particularly high, we reckon that there could also be other factors at play which could be influencing the company's growth. For example, it is possible that the company's management has made some good strategic decisions, or that the company has a low payout ratio.
We then compared Simulations Plus' net income growth with the industry and we're pleased to see that the company's growth figure is higher when compared with the industry which has a growth rate of 12% in the same period.
Earnings growth is a huge factor in stock valuation. The investor should try to establish if the expected growth or decline in earnings, whichever the case may be, is priced in. Doing so will help them establish if the stock's future looks promising or ominous. What is SLP worth today? The intrinsic value infographic in our free research report helps visualize whether SLP is currently mispriced by the market.
Is Simulations Plus Making Efficient Use Of Its Profits?
With a three-year median payout ratio of 46% (implying that the company retains 54% of its profits), it seems that Simulations Plus is reinvesting efficiently in a way that it sees respectable amount growth in its earnings and pays a dividend that's well covered.
Besides, Simulations Plus has been paying dividends for at least ten years or more. This shows that the company is committed to sharing profits with its shareholders.
Summary
On the whole, we do feel that Simulations Plus has some positive attributes. Even in spite of the low rate of return, the company has posted impressive earnings growth as a result of reinvesting heavily into its business. That being so, the latest analyst forecasts show that the company will continue to see an expansion in its earnings. Are these analysts expectations based on the broad expectations for the industry, or on the company's fundamentals? Click here to be taken to our analyst's forecasts page for the company.
This article by Simply Wall St is general in nature. We provide commentary based on historical data and analyst forecasts only using an unbiased methodology and our articles are not intended to be financial advice. It does not constitute a recommendation to buy or sell any stock, and does not take account of your objectives, or your financial situation. We aim to bring you long-term focused analysis driven by fundamental data. Note that our analysis may not factor in the latest price-sensitive company announcements or qualitative material. Simply Wall St has no position in any stocks mentioned.
Have feedback on this article? Concerned about the content? Get in touch with us directly. Alternatively, email editorial-team (at) simplywallst.com.
