Sinclair (SBGI) Q2 Earnings Miss Estimates, Revenues Fall Y/Y
Sinclair, Inc. SBGI reported a loss of $1.38 per share in the second quarter of 2023, wider than the Zacks Consensus Estimate of a loss of 58 cents. The company had incurred a loss of 17 cents per share in the year-ago quarter.
Revenues of $768 million beat the consensus mark by 0.3% but declined 8.24% year over year.
Diversified portfolio of investment assets has returned an internal rate of return (IRR) of 19% over the past 10 years and hurdle rate goal of 15-20% IRRs for new investments, which will focus on majority-owned assets in media and non-media industries.
Sinclair, Inc. Price, Consensus and EPS Surprise
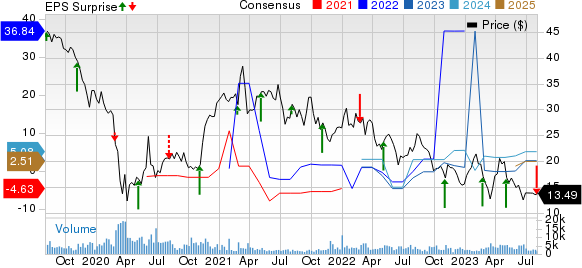
Sinclair, Inc. price-consensus-eps-surprise-chart | Sinclair, Inc. Quote
Quarter in Detail
Distribution Revenues (54.4% of total revenues) decreased 2.79% year over year to $418 million. The figure beat the Zacks Consensus Estimate by 1.45%.
Advertising revenues (40.2% of total revenues) decreased 16% year over year to $309 million. The figure missed the Zacks Consensus Estimate by 0.65%.
Adjusted EBITDA decreased 42% to $107 million from $183 million in the prior-year period.
Media programming and production expenses flared up 0.84% year over year to $413 million. Media selling, general and administrative expenses rose 0.84% year over year to $190 million. Corporate general and administrative expenses surged 63.15% year over year to $62 million.
The company reported an adjusted operating loss of $3 million versus an operating income of $107 million in the prior-year period of $13 million.
Balance Sheet and Cash Flows
As of Jun 30, 2023, the total debt was $4.2 billion. Consolidated cash at the end of the quarter was $728 million and liquidity was $1.4 billion.
The company repurchased $32 million principal value of various STG debt tranches in the open market at a discount throughout the quarter.
Guidance
Sinclair projects third-quarter 2023 revenues between $742 million and $763 million. The company estimates a year-over-year decline of 10-12% in revenue growth.
Adjusted EBITDA is estimated between $91 million and $109 million.
Adjusted Free Cash Flow is estimated in the band of negative $9-$14 million.
For 2023, SBGI expects Media programming & production expenses to be $2.37 billion and media selling, general and administrative expenses to be $2.38 billion.
Zacks Rank & Other Stocks to Consider
SBGI currently carries a Zacks Rank #2 (Buy).
Some other top-ranked stocks in the Consumer Discretionary sector are PlayAGS AGS, DraftKings DKNG and Hasbro HAS. AGS currently sports a Zacks Rank #1 (Strong Buy), while DKNG and HAS carry a Zacks Rank #2 at present. You can see the complete list of today’s Zacks #1 Rank stocks here.
PlayAGS, DraftKings and Hasbro are each scheduled to report the quarterly results on Aug 3.
The Zacks Consensus Estimate for AGS’ second-quarter 2023 loss per share is pegged at 1 cent, which has remained unchanged over the past 30 days.
The Zacks Consensus Estimate for DKNG’s second-quarter 2023 loss is pegged at 25 cents per share, up from a loss of 29 cents per share over the past 30 days.
The Zacks Consensus Estimate for HAS’ second-quarter 2023 earnings is pegged at 58 cents per share, which has increased by a cent over the past 30 days.
Want the latest recommendations from Zacks Investment Research? Today, you can download 7 Best Stocks for the Next 30 Days. Click to get this free report
Hasbro, Inc. (HAS) : Free Stock Analysis Report
Sinclair, Inc. (SBGI) : Free Stock Analysis Report
PlayAGS, Inc. (AGS) : Free Stock Analysis Report
DraftKings Inc. (DKNG) : Free Stock Analysis Report
