SKAN Group AG's (VTX:SKAN) Stock Has Fared Decently: Is the Market Following Strong Financials?
SKAN Group's (VTX:SKAN) stock up by 1.7% over the past three months. Since the market usually pay for a company’s long-term financial health, we decided to study the company’s fundamentals to see if they could be influencing the market. Particularly, we will be paying attention to SKAN Group's ROE today.
Return on equity or ROE is an important factor to be considered by a shareholder because it tells them how effectively their capital is being reinvested. Put another way, it reveals the company's success at turning shareholder investments into profits.
Check out our latest analysis for SKAN Group
How Do You Calculate Return On Equity?
ROE can be calculated by using the formula:
Return on Equity = Net Profit (from continuing operations) ÷ Shareholders' Equity
So, based on the above formula, the ROE for SKAN Group is:
16% = CHF28m ÷ CHF176m (Based on the trailing twelve months to December 2023).
The 'return' is the amount earned after tax over the last twelve months. Another way to think of that is that for every CHF1 worth of equity, the company was able to earn CHF0.16 in profit.
What Has ROE Got To Do With Earnings Growth?
Thus far, we have learned that ROE measures how efficiently a company is generating its profits. Based on how much of its profits the company chooses to reinvest or "retain", we are then able to evaluate a company's future ability to generate profits. Assuming everything else remains unchanged, the higher the ROE and profit retention, the higher the growth rate of a company compared to companies that don't necessarily bear these characteristics.
SKAN Group's Earnings Growth And 16% ROE
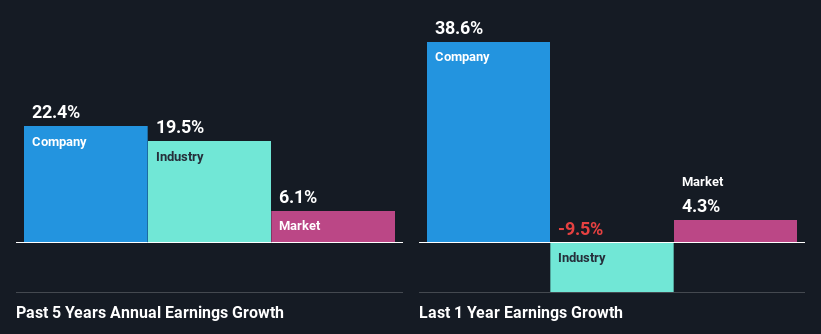
To start with, SKAN Group's ROE looks acceptable. Especially when compared to the industry average of 9.1% the company's ROE looks pretty impressive. This certainly adds some context to SKAN Group's exceptional 22% net income growth seen over the past five years. However, there could also be other causes behind this growth. Such as - high earnings retention or an efficient management in place.
As a next step, we compared SKAN Group's net income growth with the industry and found that the company has a similar growth figure when compared with the industry average growth rate of 19% in the same period.
The basis for attaching value to a company is, to a great extent, tied to its earnings growth. What investors need to determine next is if the expected earnings growth, or the lack of it, is already built into the share price. By doing so, they will have an idea if the stock is headed into clear blue waters or if swampy waters await. What is SKAN worth today? The intrinsic value infographic in our free research report helps visualize whether SKAN is currently mispriced by the market.
Is SKAN Group Using Its Retained Earnings Effectively?
SKAN Group has a three-year median payout ratio of 43% (where it is retaining 57% of its income) which is not too low or not too high. This suggests that its dividend is well covered, and given the high growth we discussed above, it looks like SKAN Group is reinvesting its earnings efficiently.
Additionally, SKAN Group has paid dividends over a period of at least ten years which means that the company is pretty serious about sharing its profits with shareholders. Existing analyst estimates suggest that the company's future payout ratio is expected to drop to 34% over the next three years.
Summary
Overall, we are quite pleased with SKAN Group's performance. In particular, it's great to see that the company is investing heavily into its business and along with a high rate of return, that has resulted in a sizeable growth in its earnings. With that said, the latest industry analyst forecasts reveal that the company's earnings are expected to accelerate. To know more about the company's future earnings growth forecasts take a look at this free report on analyst forecasts for the company to find out more.
Have feedback on this article? Concerned about the content? Get in touch with us directly. Alternatively, email editorial-team (at) simplywallst.com.
This article by Simply Wall St is general in nature. We provide commentary based on historical data and analyst forecasts only using an unbiased methodology and our articles are not intended to be financial advice. It does not constitute a recommendation to buy or sell any stock, and does not take account of your objectives, or your financial situation. We aim to bring you long-term focused analysis driven by fundamental data. Note that our analysis may not factor in the latest price-sensitive company announcements or qualitative material. Simply Wall St has no position in any stocks mentioned.
