SL Green Realty Corp (SLG): A Deep Dive into Its Performance Metrics
Long-established in the REITs industry, SL Green Realty Corp (NYSE:SLG) has enjoyed a stellar reputation. It has recently witnessed a daily gain of 4.71%, juxtaposed with a three-month change of 70.16%. However, fresh insights from the GuruFocus Score Rating hint at potential headwinds. Notably, its diminished rankings in financial strength, growth, and valuation suggest that the company might not live up to its historical performance. Join us as we dive deep into these pivotal metrics to unravel the evolving narrative of SL Green Realty Corp.
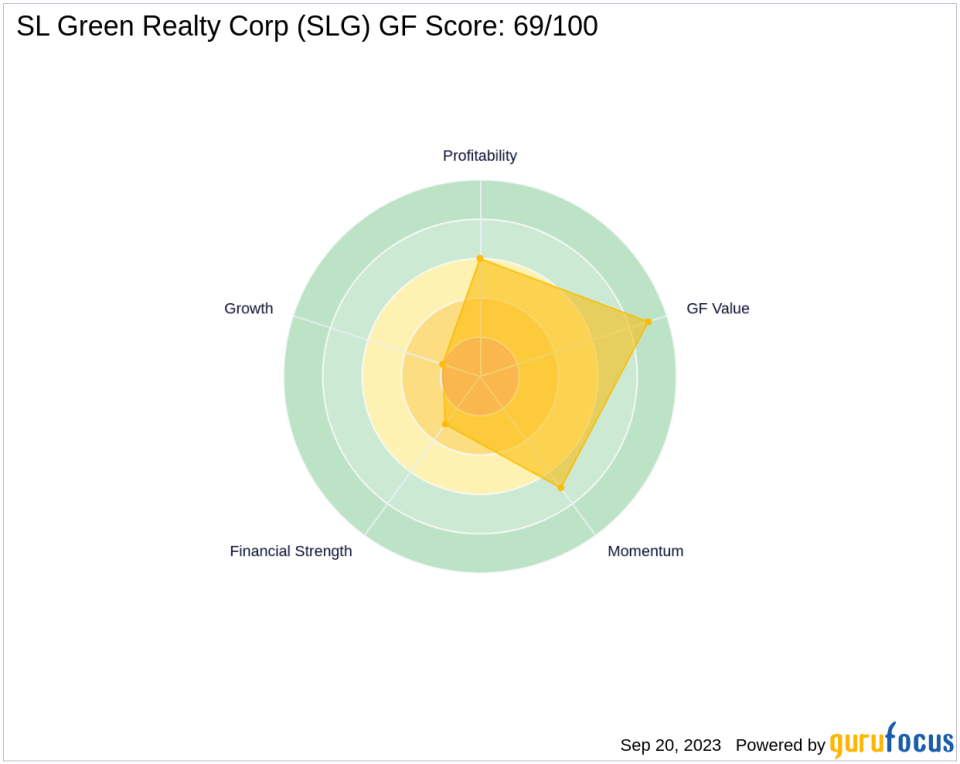
Understanding the GF Score
The GF Score is a stock performance ranking system developed by GuruFocus using five aspects of valuation, which has been found to be closely correlated to the long-term performances of stocks by backtesting from 2006 to 2021. The stocks with a higher GF Score generally generate higher returns than those with a lower GF Score. Therefore, when picking stocks, investors should invest in companies with high GF Scores. The GF Score ranges from 0 to 100, with 100 as the highest rank.
Financial strength rank: 3/10
Profitability rank: 6/10
Growth rank: 2/10
GF Value rank: 9/10
Momentum rank: 7/10
Based on the above method, GuruFocus assigned SL Green Realty Corp the GF Score of 69 out of 100, which signals poor future outperformance potential.
SL Green Realty Corp: A Snapshot
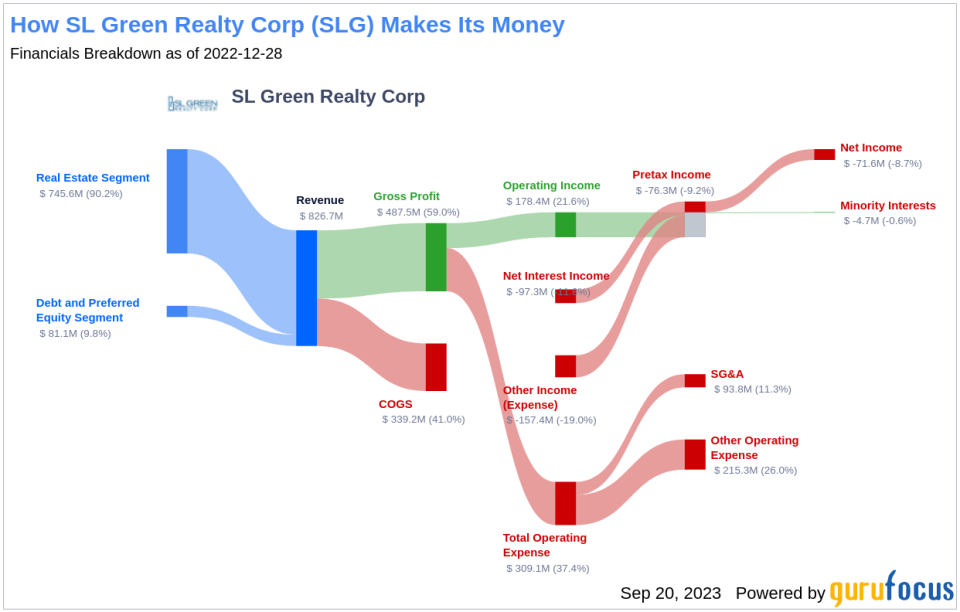
SL Green Realty Corp, with a market cap of $2.76 billion, is one of the largest Manhattan property owners and landlords, with interest in around 35 million square feet of wholly owned and joint-venture office space. The company also has additional property exposure through its limited portfolio of well-located retail space. It operates as a real estate investment trust. The company's sales stand at $881.98 million with an operating margin of 16.49%.
Financial Strength Analysis
SL Green Realty Corp's financial strength indicators present some concerning insights about the company's balance sheet health. The company has an interest coverage ratio of 1.05, which positions it worse than 88.7% of 655 companies in the REITs industry. This ratio highlights potential challenges the company might face when handling its interest expenses on outstanding debt. The company's Altman Z-Scoreis just 0.29, which is below the distress zone of 1.81. This suggests that the company may face financial distress over the next few years. Additionally, the company's low cash-to-debt ratio at 0.04 indicates a struggle in handling existing debt levels.
Growth Prospects
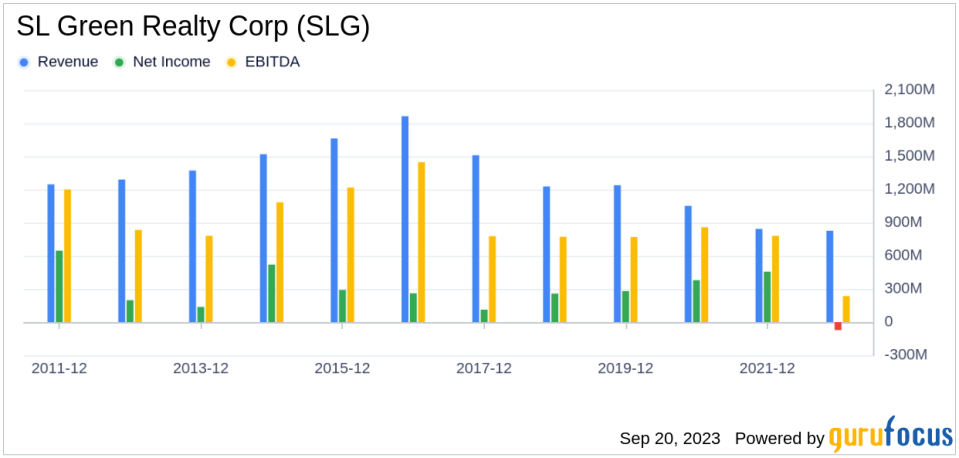
A lack of significant growth is another area where SL Green Realty Corp seems to falter, as evidenced by the company's low Growth rank. The company's revenue has declined by -6.1 per year over the past three years, which underperforms worse than 79.02% of 634 companies in the REITs industry. Stagnating revenues may pose concerns in a fast-evolving market. Over the past five years, SL Green Realty Corp has witnessed a decline in its earnings before interest, taxes, depreciation, and amortization (EBITDA). The three-year growth rate is recorded at -27.6, while the five-year growth rate is at -8.6. These figures underscore potential challenges in the company's profitability. Lastly, SL Green Realty Corp predictability rank is just one star out of five, adding to investor uncertainty regarding revenue and earnings consistency.
Conclusion
Given the company's financial strength, profitability, and growth metrics, the GuruFocus Score Rating highlights the firm's unparalleled position for potential underperformance. While SL Green Realty Corp has a strong reputation in the REITs industry, its current financial and growth indicators suggest that it may struggle to maintain its historical performance. Investors should consider these factors when making investment decisions.
GuruFocus Premium members can find more companies with strong GF Scores using the following screener link: GF Score Screen
This article first appeared on GuruFocus.
