A Sliding Share Price Has Us Looking At The Buckle, Inc.'s (NYSE:BKE) P/E Ratio

Unfortunately for some shareholders, the Buckle (NYSE:BKE) share price has dived 33% in the last thirty days. Even longer term holders have taken a real hit with the stock declining 4.1% in the last year.
All else being equal, a share price drop should make a stock more attractive to potential investors. In the long term, share prices tend to follow earnings per share, but in the short term prices bounce around in response to short term factors (which are not always obvious). The implication here is that long term investors have an opportunity when expectations of a company are too low. One way to gauge market expectations of a stock is to look at its Price to Earnings Ratio (PE Ratio). A high P/E ratio means that investors have a high expectation about future growth, while a low P/E ratio means they have low expectations about future growth.
View our latest analysis for Buckle
How Does Buckle's P/E Ratio Compare To Its Peers?
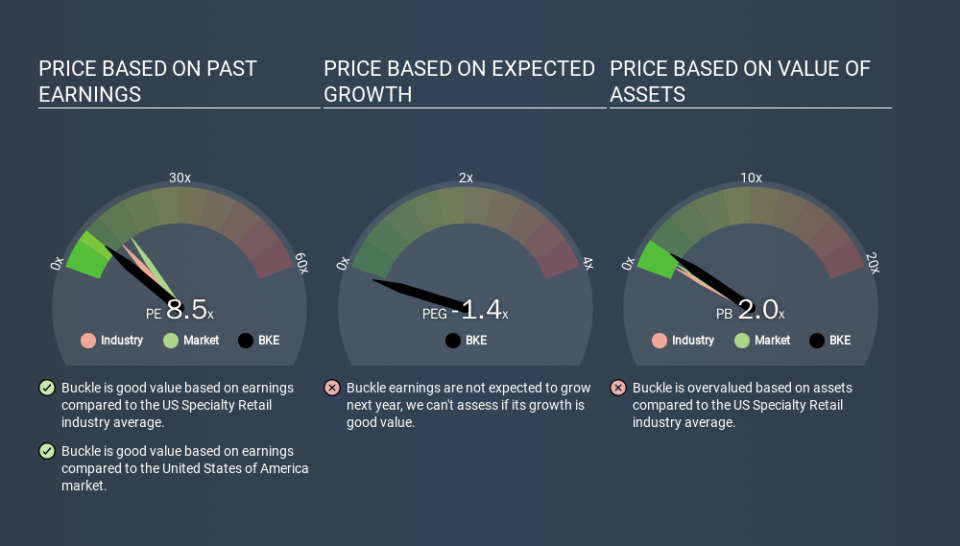
We can tell from its P/E ratio of 8.53 that sentiment around Buckle isn't particularly high. If you look at the image below, you can see Buckle has a lower P/E than the average (11.2) in the specialty retail industry classification.
Buckle's P/E tells us that market participants think it will not fare as well as its peers in the same industry. While current expectations are low, the stock could be undervalued if the situation is better than the market assumes. If you consider the stock interesting, further research is recommended. For example, I often monitor director buying and selling.
How Growth Rates Impact P/E Ratios
Companies that shrink earnings per share quickly will rapidly decrease the 'E' in the equation. That means unless the share price falls, the P/E will increase in a few years. So while a stock may look cheap based on past earnings, it could be expensive based on future earnings.
Buckle maintained roughly steady earnings over the last twelve months. And EPS is down 9.7% a year, over the last 5 years. So it would be surprising to see a high P/E.
Remember: P/E Ratios Don't Consider The Balance Sheet
One drawback of using a P/E ratio is that it considers market capitalization, but not the balance sheet. In other words, it does not consider any debt or cash that the company may have on the balance sheet. Hypothetically, a company could reduce its future P/E ratio by spending its cash (or taking on debt) to achieve higher earnings.
While growth expenditure doesn't always pay off, the point is that it is a good option to have; but one that the P/E ratio ignores.
Is Debt Impacting Buckle's P/E?
With net cash of US$246m, Buckle has a very strong balance sheet, which may be important for its business. Having said that, at 29% of its market capitalization the cash hoard would contribute towards a higher P/E ratio.
The Verdict On Buckle's P/E Ratio
Buckle has a P/E of 8.5. That's below the average in the US market, which is 14.7. EPS was up modestly better over the last twelve months. Also positive, the relatively strong balance sheet will allow for investment in growth. In contrast, the P/E indicates shareholders doubt that will happen! Given Buckle's P/E ratio has declined from 12.8 to 8.5 in the last month, we know for sure that the market is more worried about the business today, than it was back then. For those who prefer invest in growth, this stock apparently offers limited promise, but the deep value investors may find the pessimism around this stock enticing.
Investors have an opportunity when market expectations about a stock are wrong. As value investor Benjamin Graham famously said, 'In the short run, the market is a voting machine but in the long run, it is a weighing machine. So this free visualization of the analyst consensus on future earnings could help you make the right decision about whether to buy, sell, or hold.
But note: Buckle may not be the best stock to buy. So take a peek at this free list of interesting companies with strong recent earnings growth (and a P/E ratio below 20).
If you spot an error that warrants correction, please contact the editor at editorial-team@simplywallst.com. This article by Simply Wall St is general in nature. It does not constitute a recommendation to buy or sell any stock, and does not take account of your objectives, or your financial situation. Simply Wall St has no position in the stocks mentioned.
We aim to bring you long-term focused research analysis driven by fundamental data. Note that our analysis may not factor in the latest price-sensitive company announcements or qualitative material. Thank you for reading.
