A Sliding Share Price Has Us Looking At EnerSys's (NYSE:ENS) P/E Ratio

To the annoyance of some shareholders, EnerSys (NYSE:ENS) shares are down a considerable 34% in the last month. Even longer term holders have taken a real hit with the stock declining 25% in the last year.
Assuming nothing else has changed, a lower share price makes a stock more attractive to potential buyers. While the market sentiment towards a stock is very changeable, in the long run, the share price will tend to move in the same direction as earnings per share. The implication here is that long term investors have an opportunity when expectations of a company are too low. Perhaps the simplest way to get a read on investors' expectations of a business is to look at its Price to Earnings Ratio (PE Ratio). A high P/E implies that investors have high expectations of what a company can achieve compared to a company with a low P/E ratio.
Check out our latest analysis for EnerSys
Does EnerSys Have A Relatively High Or Low P/E For Its Industry?
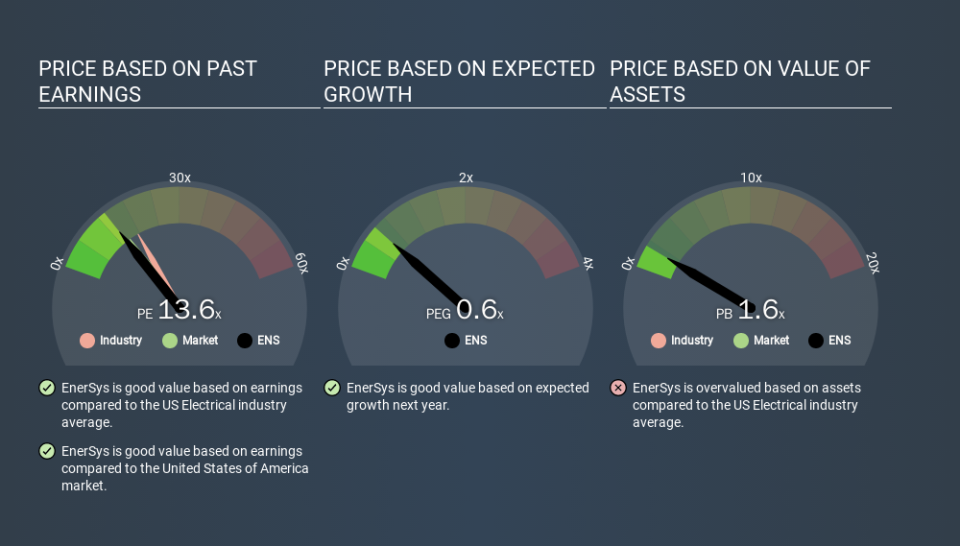
We can tell from its P/E ratio of 13.64 that sentiment around EnerSys isn't particularly high. If you look at the image below, you can see EnerSys has a lower P/E than the average (17.4) in the electrical industry classification.
EnerSys's P/E tells us that market participants think it will not fare as well as its peers in the same industry. Since the market seems unimpressed with EnerSys, it's quite possible it could surprise on the upside. If you consider the stock interesting, further research is recommended. For example, I often monitor director buying and selling.
How Growth Rates Impact P/E Ratios
P/E ratios primarily reflect market expectations around earnings growth rates. That's because companies that grow earnings per share quickly will rapidly increase the 'E' in the equation. That means unless the share price increases, the P/E will reduce in a few years. A lower P/E should indicate the stock is cheap relative to others -- and that may attract buyers.
EnerSys shrunk earnings per share by 20% over the last year. But over the longer term (3 years), earnings per share have increased by 5.7%.
Don't Forget: The P/E Does Not Account For Debt or Bank Deposits
The 'Price' in P/E reflects the market capitalization of the company. In other words, it does not consider any debt or cash that the company may have on the balance sheet. Hypothetically, a company could reduce its future P/E ratio by spending its cash (or taking on debt) to achieve higher earnings.
Such expenditure might be good or bad, in the long term, but the point here is that the balance sheet is not reflected by this ratio.
Is Debt Impacting EnerSys's P/E?
Net debt is 39% of EnerSys's market cap. While it's worth keeping this in mind, it isn't a worry.
The Verdict On EnerSys's P/E Ratio
EnerSys has a P/E of 13.6. That's around the same as the average in the US market, which is 14.7. With modest debt, and a lack of recent growth, it would seem the market is expecting improvement in earnings. What can be absolutely certain is that the market has become significantly less optimistic about EnerSys over the last month, with the P/E ratio falling from 20.7 back then to 13.6 today. For those who don't like to trade against momentum, that could be a warning sign, but a contrarian investor might want to take a closer look.
Investors have an opportunity when market expectations about a stock are wrong. As value investor Benjamin Graham famously said, 'In the short run, the market is a voting machine but in the long run, it is a weighing machine. So this free report on the analyst consensus forecasts could help you make a master move on this stock.
Of course you might be able to find a better stock than EnerSys. So you may wish to see this free collection of other companies that have grown earnings strongly.
If you spot an error that warrants correction, please contact the editor at editorial-team@simplywallst.com. This article by Simply Wall St is general in nature. It does not constitute a recommendation to buy or sell any stock, and does not take account of your objectives, or your financial situation. Simply Wall St has no position in the stocks mentioned.
We aim to bring you long-term focused research analysis driven by fundamental data. Note that our analysis may not factor in the latest price-sensitive company announcements or qualitative material. Thank you for reading.
