A Sliding Share Price Has Us Looking At MSA Safety Incorporated's (NYSE:MSA) P/E Ratio

Unfortunately for some shareholders, the MSA Safety (NYSE:MSA) share price has dived 31% in the last thirty days. Even longer term holders have taken a real hit with the stock declining 5.3% in the last year.
Assuming nothing else has changed, a lower share price makes a stock more attractive to potential buyers. In the long term, share prices tend to follow earnings per share, but in the short term prices bounce around in response to short term factors (which are not always obvious). The implication here is that long term investors have an opportunity when expectations of a company are too low. Perhaps the simplest way to get a read on investors' expectations of a business is to look at its Price to Earnings Ratio (PE Ratio). A high P/E implies that investors have high expectations of what a company can achieve compared to a company with a low P/E ratio.
Check out our latest analysis for MSA Safety
Does MSA Safety Have A Relatively High Or Low P/E For Its Industry?
MSA Safety's P/E of 27.41 indicates some degree of optimism towards the stock. You can see in the image below that the average P/E (23.4) for companies in the commercial services industry is lower than MSA Safety's P/E.
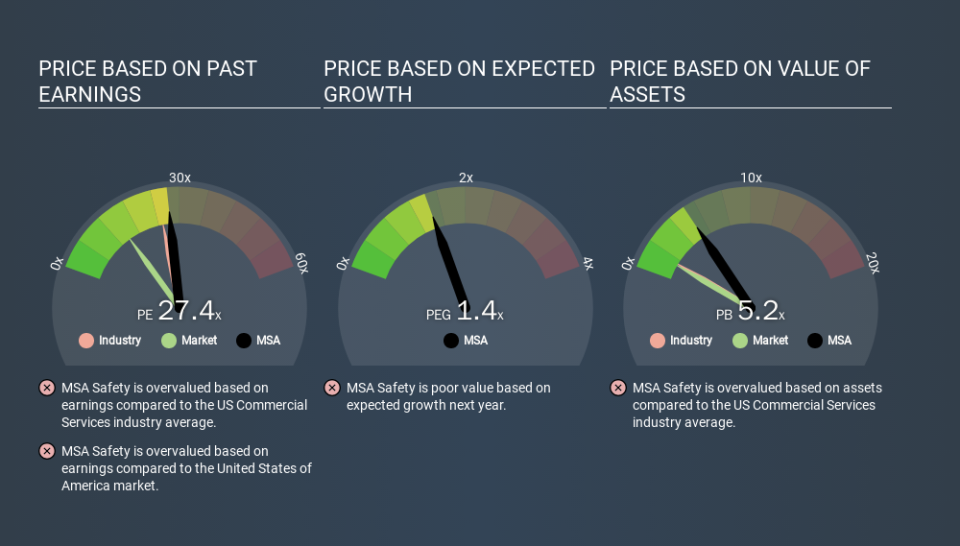
MSA Safety's P/E tells us that market participants think the company will perform better than its industry peers, going forward. The market is optimistic about the future, but that doesn't guarantee future growth. So further research is always essential. I often monitor director buying and selling.
How Growth Rates Impact P/E Ratios
P/E ratios primarily reflect market expectations around earnings growth rates. Earnings growth means that in the future the 'E' will be higher. That means even if the current P/E is high, it will reduce over time if the share price stays flat. And as that P/E ratio drops, the company will look cheap, unless its share price increases.
MSA Safety's earnings per share grew by -9.0% in the last twelve months. And it has bolstered its earnings per share by 8.7% per year over the last five years.
A Limitation: P/E Ratios Ignore Debt and Cash In The Bank
It's important to note that the P/E ratio considers the market capitalization, not the enterprise value. Thus, the metric does not reflect cash or debt held by the company. Hypothetically, a company could reduce its future P/E ratio by spending its cash (or taking on debt) to achieve higher earnings.
While growth expenditure doesn't always pay off, the point is that it is a good option to have; but one that the P/E ratio ignores.
Is Debt Impacting MSA Safety's P/E?
MSA Safety has net debt worth just 3.9% of its market capitalization. So it doesn't have as many options as it would with net cash, but its debt would not have much of an impact on its P/E ratio.
The Bottom Line On MSA Safety's P/E Ratio
MSA Safety trades on a P/E ratio of 27.4, which is above its market average of 13.3. With debt at prudent levels and improving earnings, it's fair to say the market expects steady progress in the future. What can be absolutely certain is that the market has become significantly less optimistic about MSA Safety over the last month, with the P/E ratio falling from 39.9 back then to 27.4 today. For those who prefer to invest with the flow of momentum, that might be a bad sign, but for a contrarian, it may signal opportunity.
Investors have an opportunity when market expectations about a stock are wrong. People often underestimate remarkable growth -- so investors can make money when fast growth is not fully appreciated. So this free visual report on analyst forecasts could hold the key to an excellent investment decision.
But note: MSA Safety may not be the best stock to buy. So take a peek at this free list of interesting companies with strong recent earnings growth (and a P/E ratio below 20).
If you spot an error that warrants correction, please contact the editor at editorial-team@simplywallst.com. This article by Simply Wall St is general in nature. It does not constitute a recommendation to buy or sell any stock, and does not take account of your objectives, or your financial situation. Simply Wall St has no position in the stocks mentioned.
We aim to bring you long-term focused research analysis driven by fundamental data. Note that our analysis may not factor in the latest price-sensitive company announcements or qualitative material. Thank you for reading.
