A Sliding Share Price Has Us Looking At Tennant Company's (NYSE:TNC) P/E Ratio

To the annoyance of some shareholders, Tennant (NYSE:TNC) shares are down a considerable 35% in the last month. Even longer term holders have taken a real hit with the stock declining 12% in the last year.
Assuming nothing else has changed, a lower share price makes a stock more attractive to potential buyers. In the long term, share prices tend to follow earnings per share, but in the short term prices bounce around in response to short term factors (which are not always obvious). The implication here is that long term investors have an opportunity when expectations of a company are too low. One way to gauge market expectations of a stock is to look at its Price to Earnings Ratio (PE Ratio). A high P/E ratio means that investors have a high expectation about future growth, while a low P/E ratio means they have low expectations about future growth.
View our latest analysis for Tennant
How Does Tennant's P/E Ratio Compare To Its Peers?
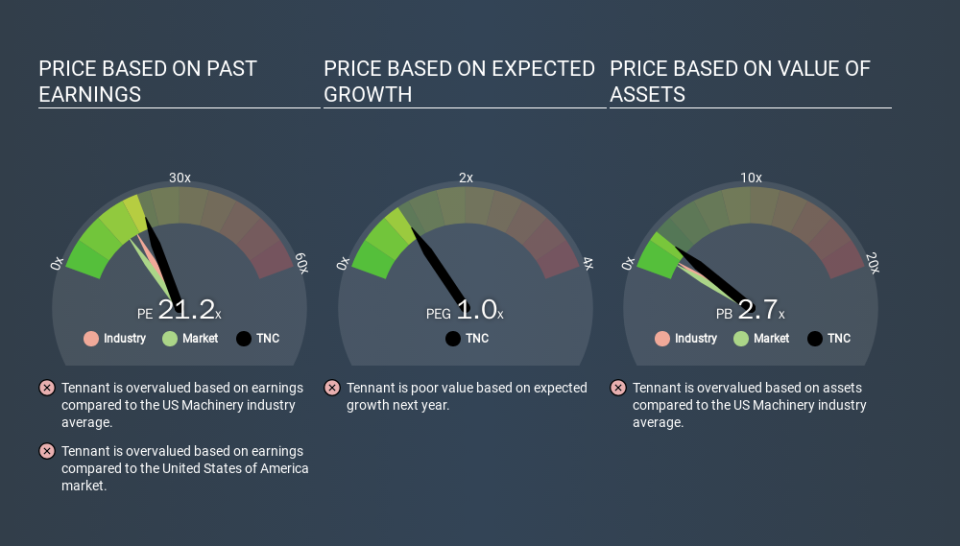
Tennant's P/E of 21.21 indicates some degree of optimism towards the stock. You can see in the image below that the average P/E (16.0) for companies in the machinery industry is lower than Tennant's P/E.
Its relatively high P/E ratio indicates that Tennant shareholders think it will perform better than other companies in its industry classification. Clearly the market expects growth, but it isn't guaranteed. So investors should always consider the P/E ratio alongside other factors, such as whether company directors have been buying shares.
How Growth Rates Impact P/E Ratios
If earnings fall then in the future the 'E' will be lower. That means even if the current P/E is low, it will increase over time if the share price stays flat. A higher P/E should indicate the stock is expensive relative to others -- and that may encourage shareholders to sell.
It's nice to see that Tennant grew EPS by a stonking 36% in the last year. But earnings per share are down 1.9% per year over the last five years.
Don't Forget: The P/E Does Not Account For Debt or Bank Deposits
Don't forget that the P/E ratio considers market capitalization. So it won't reflect the advantage of cash, or disadvantage of debt. The exact same company would hypothetically deserve a higher P/E ratio if it had a strong balance sheet, than if it had a weak one with lots of debt, because a cashed up company can spend on growth.
Such expenditure might be good or bad, in the long term, but the point here is that the balance sheet is not reflected by this ratio.
So What Does Tennant's Balance Sheet Tell Us?
Tennant's net debt equates to 27% of its market capitalization. While that's enough to warrant consideration, it doesn't really concern us.
The Bottom Line On Tennant's P/E Ratio
Tennant has a P/E of 21.2. That's higher than the average in its market, which is 13.3. The company is not overly constrained by its modest debt levels, and its recent EPS growth is nothing short of stand-out. So on this analysis a high P/E ratio seems reasonable. What can be absolutely certain is that the market has become significantly less optimistic about Tennant over the last month, with the P/E ratio falling from 32.4 back then to 21.2 today. For those who don't like to trade against momentum, that could be a warning sign, but a contrarian investor might want to take a closer look.
Investors should be looking to buy stocks that the market is wrong about. People often underestimate remarkable growth -- so investors can make money when fast growth is not fully appreciated. So this free visual report on analyst forecasts could hold the key to an excellent investment decision.
But note: Tennant may not be the best stock to buy. So take a peek at this free list of interesting companies with strong recent earnings growth (and a P/E ratio below 20).
If you spot an error that warrants correction, please contact the editor at editorial-team@simplywallst.com. This article by Simply Wall St is general in nature. It does not constitute a recommendation to buy or sell any stock, and does not take account of your objectives, or your financial situation. Simply Wall St has no position in the stocks mentioned.
We aim to bring you long-term focused research analysis driven by fundamental data. Note that our analysis may not factor in the latest price-sensitive company announcements or qualitative material. Thank you for reading.
