A Sliding Share Price Has Us Looking At Integral Diagnostics Limited's (ASX:IDX) P/E Ratio

Unfortunately for some shareholders, the Integral Diagnostics (ASX:IDX) share price has dived 30% in the last thirty days. Looking back over the last year, the stock has been a solid performer, with a gain of 11%.
All else being equal, a share price drop should make a stock more attractive to potential investors. While the market sentiment towards a stock is very changeable, in the long run, the share price will tend to move in the same direction as earnings per share. So, on certain occasions, long term focussed investors try to take advantage of pessimistic expectations to buy shares at a better price. Perhaps the simplest way to get a read on investors' expectations of a business is to look at its Price to Earnings Ratio (PE Ratio). Investors have optimistic expectations of companies with higher P/E ratios, compared to companies with lower P/E ratios.
View our latest analysis for Integral Diagnostics
How Does Integral Diagnostics's P/E Ratio Compare To Its Peers?
We can tell from its P/E ratio of 22.50 that there is some investor optimism about Integral Diagnostics. The image below shows that Integral Diagnostics has a higher P/E than the average (13.0) P/E for companies in the healthcare industry.
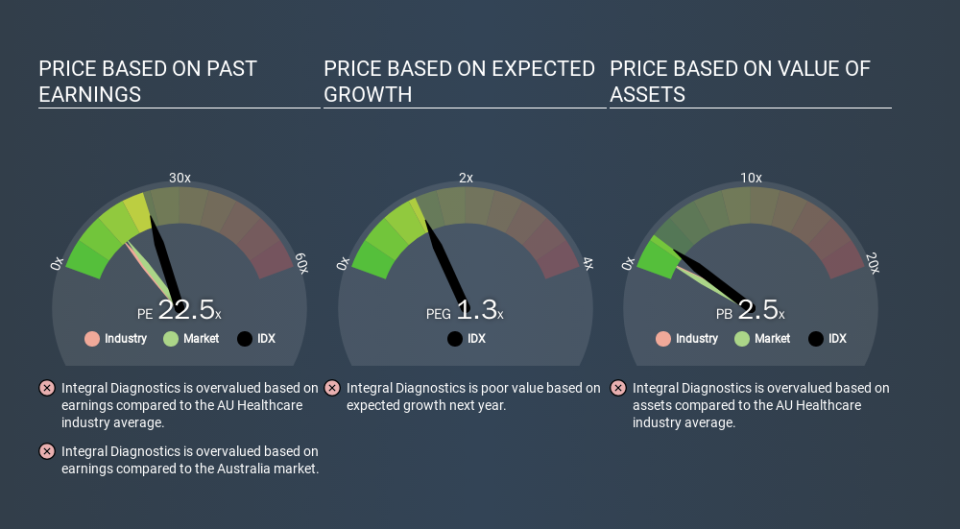
That means that the market expects Integral Diagnostics will outperform other companies in its industry. Shareholders are clearly optimistic, but the future is always uncertain. So investors should always consider the P/E ratio alongside other factors, such as whether company directors have been buying shares.
How Growth Rates Impact P/E Ratios
Earnings growth rates have a big influence on P/E ratios. When earnings grow, the 'E' increases, over time. Therefore, even if you pay a high multiple of earnings now, that multiple will become lower in the future. And as that P/E ratio drops, the company will look cheap, unless its share price increases.
Integral Diagnostics saw earnings per share improve by 8.8% last year. And it has bolstered its earnings per share by 27% per year over the last five years.
A Limitation: P/E Ratios Ignore Debt and Cash In The Bank
It's important to note that the P/E ratio considers the market capitalization, not the enterprise value. That means it doesn't take debt or cash into account. In theory, a company can lower its future P/E ratio by using cash or debt to invest in growth.
Such expenditure might be good or bad, in the long term, but the point here is that the balance sheet is not reflected by this ratio.
So What Does Integral Diagnostics's Balance Sheet Tell Us?
Integral Diagnostics has net debt worth 19% of its market capitalization. It would probably deserve a higher P/E ratio if it was net cash, since it would have more options for growth.
The Verdict On Integral Diagnostics's P/E Ratio
Integral Diagnostics trades on a P/E ratio of 22.5, which is above its market average of 13.9. Given the debt is only modest, and earnings are already moving in the right direction, it's not surprising that the market expects continued improvement. Given Integral Diagnostics's P/E ratio has declined from 32.3 to 22.5 in the last month, we know for sure that the market is significantly less confident about the business today, than it was back then. For those who prefer to invest with the flow of momentum, that might be a bad sign, but for a contrarian, it may signal opportunity.
Investors should be looking to buy stocks that the market is wrong about. If the reality for a company is better than it expects, you can make money by buying and holding for the long term. So this free report on the analyst consensus forecasts could help you make a master move on this stock.
But note: Integral Diagnostics may not be the best stock to buy. So take a peek at this free list of interesting companies with strong recent earnings growth (and a P/E ratio below 20).
If you spot an error that warrants correction, please contact the editor at editorial-team@simplywallst.com. This article by Simply Wall St is general in nature. It does not constitute a recommendation to buy or sell any stock, and does not take account of your objectives, or your financial situation. Simply Wall St has no position in the stocks mentioned.
We aim to bring you long-term focused research analysis driven by fundamental data. Note that our analysis may not factor in the latest price-sensitive company announcements or qualitative material. Thank you for reading.
