Smartsheet (SMAR): A Hidden Gem or Overpriced Stock? A Comprehensive Valuation Analysis
Despite Smartsheet Inc (NYSE:SMAR)'s recent 12.72% gain and a 13.55% rise over the past three months, the stock reported a Loss Per Share of 1.35. This raises the question: is the stock significantly undervalued? Our in-depth valuation analysis aims to answer this question, providing valuable insights for potential investors. Let's delve into the financials of Smartsheet (NYSE:SMAR) and uncover its true value.
Company Overview
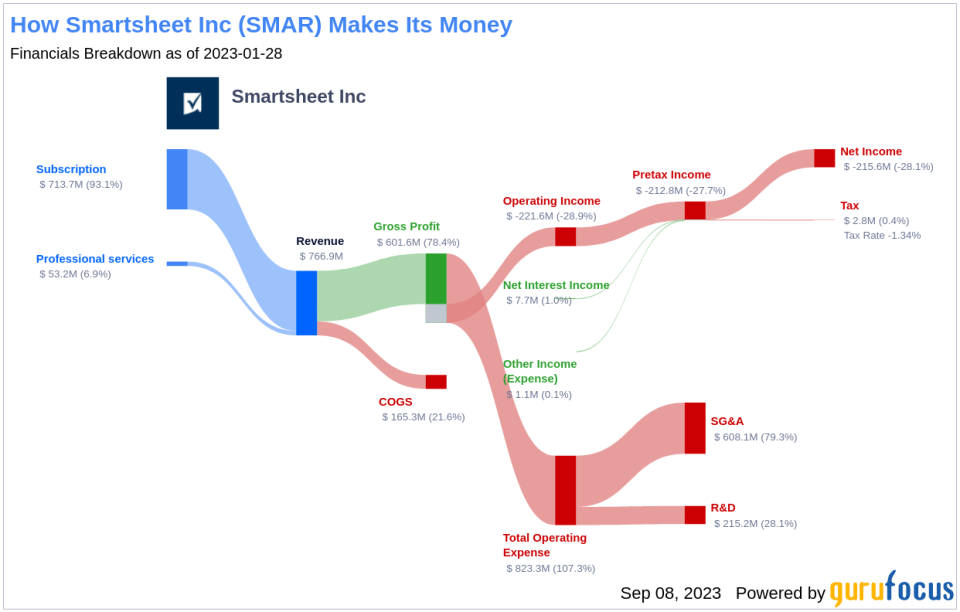
Smartsheet Inc (NYSE:SMAR) offers a cloud-based platform for work execution, enabling teams and organizations to plan, capture, manage, automate, and report on work at scale. This results in more efficient processes and improved business outcomes. The company's services range from Streamline Facilities Management to Budget and Planning Management. With the majority of its revenue generated from subscriptions, Smartsheet operates globally, with the United States being its primary market.
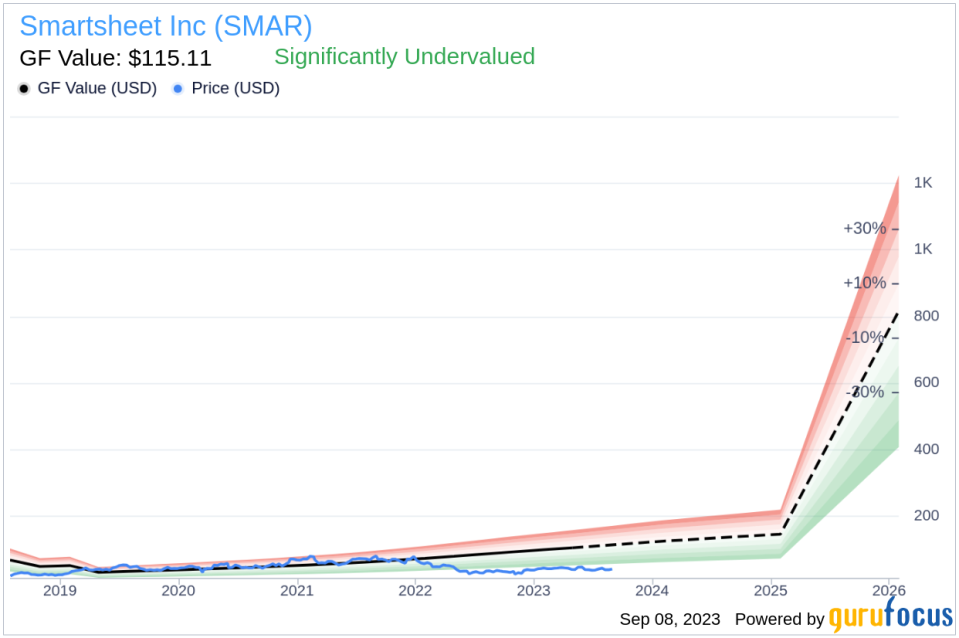
As of September 08, 2023, Smartsheet (NYSE:SMAR) trades at $45.5 per share with a market cap of $6.10 billion. Interestingly, the stock's GF Value, an estimation of its fair value, stands at $115.11, suggesting that the stock may be significantly undervalued.
Understanding the GF Value
The GF Value is a proprietary measure that represents the current intrinsic value of a stock. It is calculated based on historical multiples, a GuruFocus adjustment factor based on the company's past performance and growth, and future business performance estimates. The GF Value Line on our summary page provides an overview of the fair value at which the stock should ideally be traded.
According to the GF Value, Smartsheet (NYSE:SMAR) appears to be significantly undervalued. This implies that the long-term return of its stock is likely to be much higher than its business growth.
Link: These companies may deliver higher future returns at reduced risk.
Assessing Financial Strength
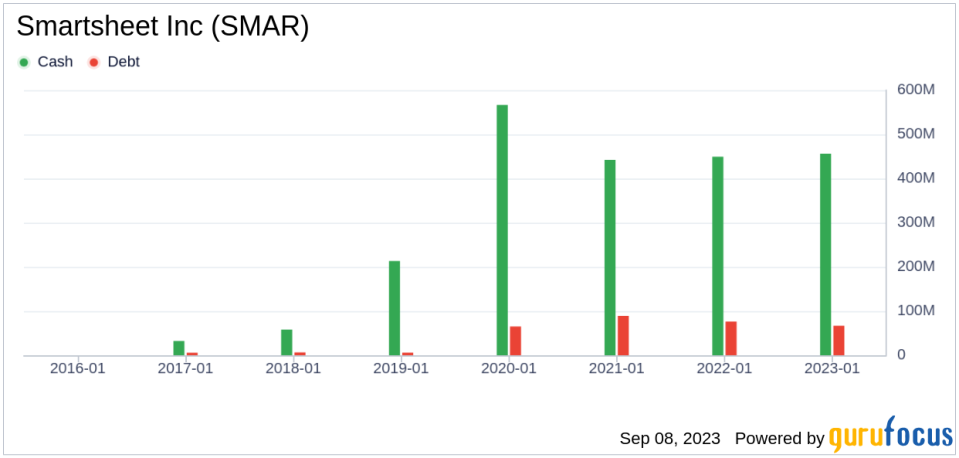
Investing in companies with poor financial strength carries a higher risk of permanent capital loss. Therefore, it's crucial to thoroughly review a company's financial strength before deciding to buy its stock. A good starting point is looking at the cash-to-debt ratio and interest coverage. Smartsheet has a cash-to-debt ratio of 7.81, which is better than 63.33% of the companies in the Software industry. GuruFocus ranks Smartsheet's overall financial strength at 7 out of 10, indicating it is fair.
Profitability and Growth
Investing in profitable companies carries less risk, especially if the company has demonstrated consistent profitability over the long term. Smartsheet has been profitable for 0 years over the past 10 years. During the past 12 months, the company had revenues of $818.50 million and a Loss Per Share of $1.35. Its operating margin of -22.47% is worse than 74.07% of the companies in the Software industry. Overall, GuruFocus ranks Smartsheet's profitability as poor.
One of the most important factors in the valuation of a company is its growth. Companies that grow faster create more value for shareholders, especially if the growth is profitable. The average annual revenue growth of Smartsheet is 35%, which ranks better than 87.77% of the companies in the Software industry. However, the 3-year average EBITDA growth is -23.7%, ranking worse than 84.32% of the companies in the industry.
ROIC vs WACC
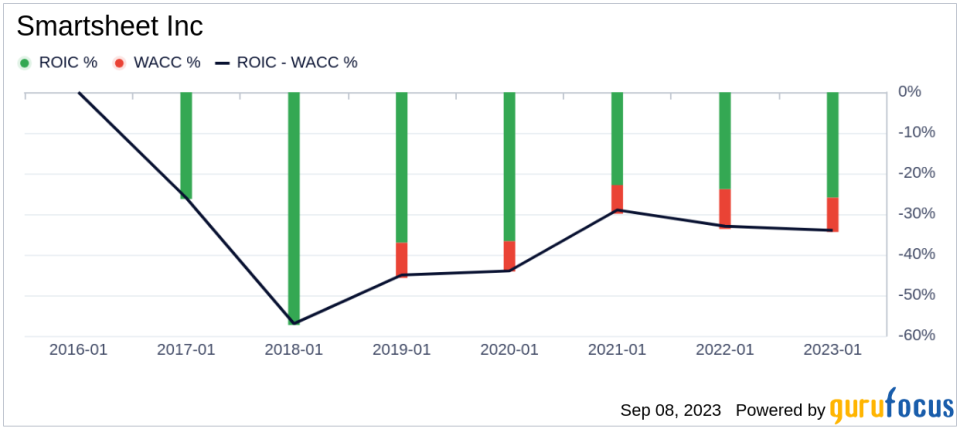
Another way to evaluate a company's profitability is to compare its return on invested capital (ROIC) to its weighted cost of capital (WACC). Return on invested capital (ROIC) measures how well a company generates cash flow relative to the capital it has invested in its business. The weighted average cost of capital (WACC) is the rate that a company is expected to pay on average to all its security holders to finance its assets. If the ROIC is higher than the WACC, it indicates that the company is creating value for shareholders. Over the past 12 months, Smartsheet's ROIC was -21.97, while its WACC came in at 7.2.
Conclusion
Based on our analysis, Smartsheet (NYSE:SMAR) stock appears to be significantly undervalued. The company's financial condition is fair, but its profitability is poor. Its growth ranks worse than 84.32% of the companies in the Software industry. To learn more about Smartsheet stock, you can check out its 30-Year Financials here.
To find high-quality companies that may deliver above-average returns, please check out the GuruFocus High Quality Low Capex Screener.
This article first appeared on GuruFocus.
