South32 Limited's (ASX:S32) market cap dropped AU$451m last week; individual investors who hold 59% were hit as were institutions
Key Insights
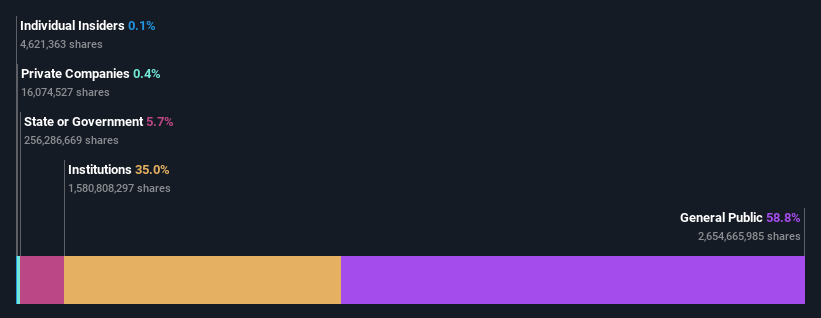
Significant control over South32 by retail investors implies that the general public has more power to influence management and governance-related decisions
The top 25 shareholders own 37% of the company
If you want to know who really controls South32 Limited (ASX:S32), then you'll have to look at the makeup of its share registry. And the group that holds the biggest piece of the pie are retail investors with 59% ownership. In other words, the group stands to gain the most (or lose the most) from their investment into the company.
While institutions who own 35% came under pressure after market cap dropped to AU$14b last week,retail investors took the most losses.
In the chart below, we zoom in on the different ownership groups of South32.
Check out our latest analysis for South32
What Does The Institutional Ownership Tell Us About South32?
Institutional investors commonly compare their own returns to the returns of a commonly followed index. So they generally do consider buying larger companies that are included in the relevant benchmark index.
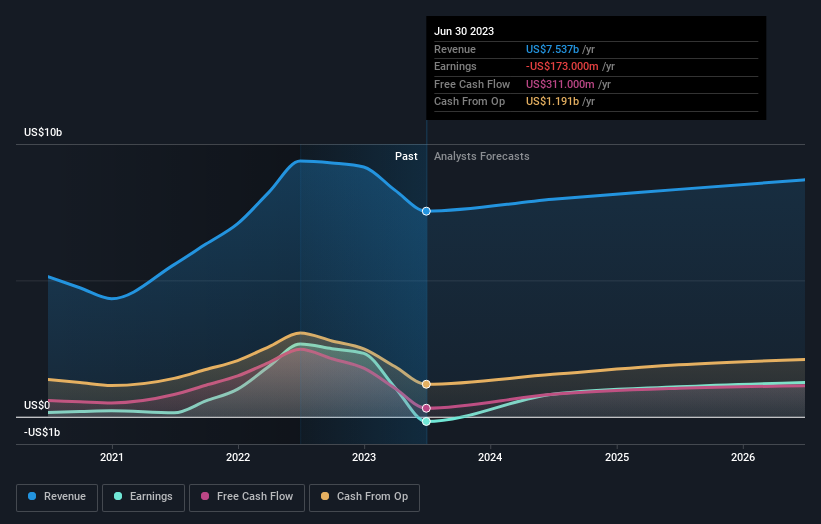
We can see that South32 does have institutional investors; and they hold a good portion of the company's stock. This implies the analysts working for those institutions have looked at the stock and they like it. But just like anyone else, they could be wrong. If multiple institutions change their view on a stock at the same time, you could see the share price drop fast. It's therefore worth looking at South32's earnings history below. Of course, the future is what really matters.
Hedge funds don't have many shares in South32. Our data shows that BlackRock, Inc. is the largest shareholder with 7.1% of shares outstanding. Meanwhile, the second and third largest shareholders, hold 5.7% and 5.2%, of the shares outstanding, respectively.
A deeper look at our ownership data shows that the top 25 shareholders collectively hold less than half of the register, suggesting a large group of small holders where no single shareholder has a majority.
While studying institutional ownership for a company can add value to your research, it is also a good practice to research analyst recommendations to get a deeper understand of a stock's expected performance. There are a reasonable number of analysts covering the stock, so it might be useful to find out their aggregate view on the future.
Insider Ownership Of South32
The definition of company insiders can be subjective and does vary between jurisdictions. Our data reflects individual insiders, capturing board members at the very least. Company management run the business, but the CEO will answer to the board, even if he or she is a member of it.
Most consider insider ownership a positive because it can indicate the board is well aligned with other shareholders. However, on some occasions too much power is concentrated within this group.
Our most recent data indicates that insiders own less than 1% of South32 Limited. As it is a large company, we'd only expect insiders to own a small percentage of it. But it's worth noting that they own AU$14m worth of shares. In this sort of situation, it can be more interesting to see if those insiders have been buying or selling.
General Public Ownership
The general public -- including retail investors -- own 59% of South32. This level of ownership gives investors from the wider public some power to sway key policy decisions such as board composition, executive compensation, and the dividend payout ratio.
Next Steps:
I find it very interesting to look at who exactly owns a company. But to truly gain insight, we need to consider other information, too. For instance, we've identified 1 warning sign for South32 that you should be aware of.
If you would prefer discover what analysts are predicting in terms of future growth, do not miss this free report on analyst forecasts.
NB: Figures in this article are calculated using data from the last twelve months, which refer to the 12-month period ending on the last date of the month the financial statement is dated. This may not be consistent with full year annual report figures.
Have feedback on this article? Concerned about the content? Get in touch with us directly. Alternatively, email editorial-team (at) simplywallst.com.
This article by Simply Wall St is general in nature. We provide commentary based on historical data and analyst forecasts only using an unbiased methodology and our articles are not intended to be financial advice. It does not constitute a recommendation to buy or sell any stock, and does not take account of your objectives, or your financial situation. We aim to bring you long-term focused analysis driven by fundamental data. Note that our analysis may not factor in the latest price-sensitive company announcements or qualitative material. Simply Wall St has no position in any stocks mentioned.
