SOXX vs. FTXL: Not All Semiconductor ETFs Are the Same
Semiconductor ETFs are generating scorching returns as stocks like Nvidia (NASDAQ:NVDA) reach new heights. However, not all semiconductor ETFs are the same. Two funds can both focus on semiconductors, but there may be vast differences in the types of semiconductor stocks they hold, the weightings of these stocks within their portfolios, their returns over time, fees, and more that investors must take into account.
Let’s take a look at two popular semiconductor ETFs, the iShares Semiconductor ETF (NASDAQ:SOXX) and the First Trust Nasdaq Semiconductor ETF (NASDAQ:FTXL). They both invest in the space but take different approaches and have generated different returns over time. I’m bullish on both ETFs, but one is the superior choice based on several factors that we’ll evaluate in this article.
What Is the SOXX ETF’s Strategy?
SOXX is an index ETF from BlackRock’s (NYSE:BLK) iShares that, according to the fund, gives investors “exposure to U.S. companies that design, manufacture, and distribute semiconductors” by investing in “an index composed of U.S.-listed equities in the semiconductor sector.” SOXX essentially invests in the 30 largest U.S. stocks classified as semiconductor companies by ICE.
SOXX launched in 2001 and has $12.8 billion in assets under management (AUM).
What Is the FTXL ETF’s Strategy?
Meanwhile, FTXL invests in an index called the Nasdaq US Smart Semiconductor Index. First Trust describes this index as a “modified factor weighted index created and administered by Nasdaq, Inc (NASDAQ:NDAQ). designed to provide exposure to US companies within the semiconductor industry.”
The stocks within this index are ranked based on three factors; their trailing 12-month return on assets, trailing 12-month gross income, and momentum based on their three-, six-, nine-, and 12-month price appreciation.
The lowest-scoring 25% of stocks from this universe based on these scores are then eliminated from the index, leaving it with a remaining group of 30-50 stocks that FTXL can potentially invest in. These remaining stocks are weighted based on their trailing 12-month cash flow and can have a weighting of up to 8% and a minimum of 0.50%.
The index is then reconstituted and rebalanced on a semiannual basis. As we’ll discuss below, these different approaches create two portfolios that have some overlap but also some key differences.
How Do Their Portfolios Compare?
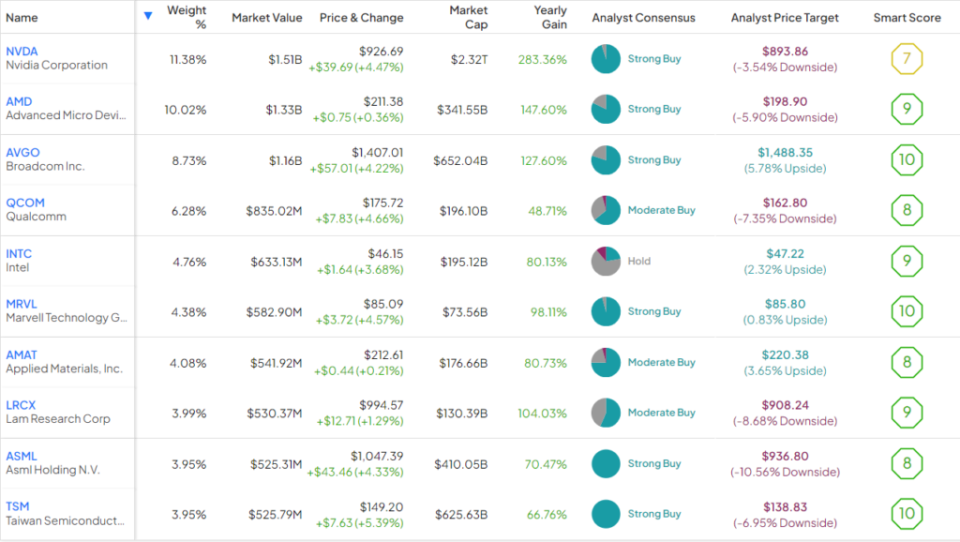
SOXX owns 30 stocks, and its top 10 holdings make up 61.7% of the fund. Below is an overview of SOXX’s top 10 holdings using TipRanks’ holdings tool.
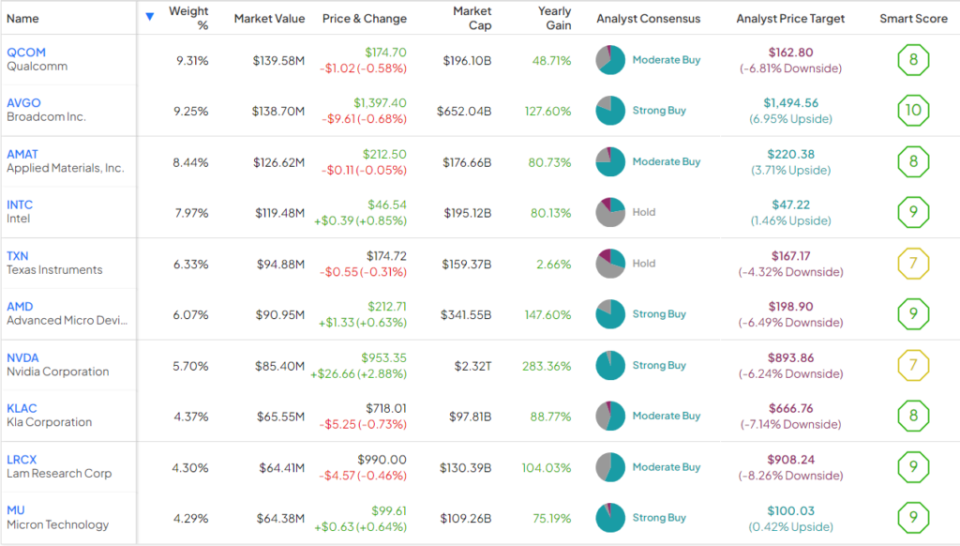
Meanwhile, FTXL owns 32 stocks, and its top 10 holdings make up 65.9% of holdings, so the two funds are very similar when it comes to diversification. Below is an overview of FTXL’s top 10 holdings using TipRanks’ holdings tool.
As you can see, SOXX has large positions with double-digit weightings in its top two holdings, Nvidia and Advanced Micro Devices (NASDAQ:AMD). These large positions have served SOXX well, as Nvidia is up 283.4% over the past year, while Advanced Micro Devices is up 147.6%.
At the same time, FTXL has a large 9.2% position in its top holding, Qualcomm (NASDAQ:QCOM). This stock has generated a 44.5% gain over the past year, which is great but is behind the astronomical returns of Nvidia and Advanced Micro Devices. Note that FTXL owns these stocks, too, but at smaller weightings of 5.7% and 6.1%, respectively.
Both funds have large positions in Broadcom (NASDAQ:AVGO), another major winner in the chip space, which has gained 127.6% over the past year.
TipRanks’ Smart Score system gives a resounding nine of SOXX’s top 10 holdings Outperform-equivalent Smart Scores of 8 or higher, and it gives eight of FTXL’s top 10 holdings Smart Scores of 8 or higher. The Smart Score is a proprietary quantitative stock scoring system created by TipRanks. It gives stocks a score from 1 to 10 based on eight market key factors. A score of 8 or above is equivalent to an Outperform rating.
Both ETFs receive Outperform-equivalent ETF Smart Scores of 8. These are both strong portfolios but Smart Score rates SOXX’s top holdings a bit more favorably, and SOXX’s top holdings have helped it outperform FTXL, as we’ll get to in the next section.
Head-to-Head Performance
When it comes to performance, these two ETFs have been long-term winners. As of February 29, FTXL has generated an impressive three-year annualized return of 11.8% and a five-year return of 24.5%.
Meanwhile, as of the same date, SOXX has generated an even more impressive three-year annualized return of 17.2% and a stunning five-year annualized return of 30.3%.
FTXL launched in 2016, so we can’t yet compare the two ETFs on a 10-year timeframe, but SOXX’s 10-year return of 25.3% over the past decade is excellent.
FTXL’s returns are good, but SOXX’s are even better, and it has a longer track record of excellence, giving SOXX a clear edge in this category. Both ETFs have sound strategies, but it seems that SOXX’s strategy of simply investing in the largest 30 U.S. semiconductor equities has generated a stronger performance than FTXL’s more nuanced strategy over time.
Is SOXX Stock a Buy, According to Analysts?
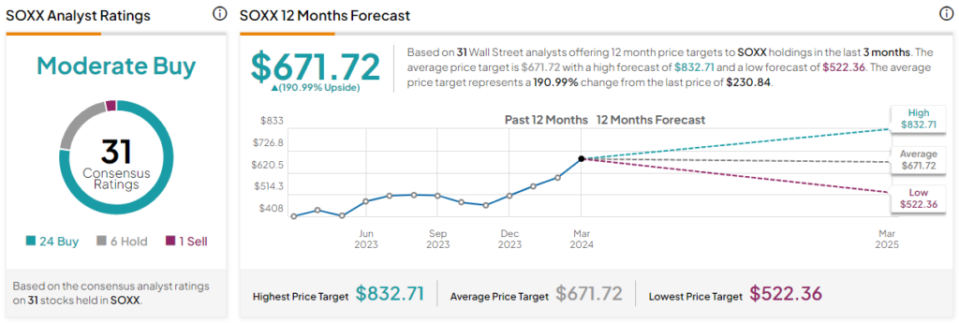
Turning to Wall Street, SOXX earns a Moderate Buy consensus rating based on 24 Buys, six Holds, and one Sell rating assigned in the past three months. The average SOXX stock price target of $671.72 implies 191% upside potential from current levels.
Is FTXL Stock a Buy, According to Analysts?
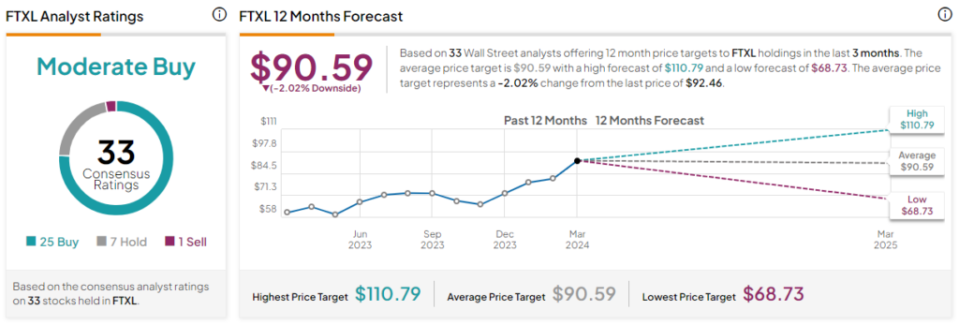
Turning to Wall Street, FTXL earns a Moderate Buy consensus rating based on 25 Buys, seven Holds, and one Sell rating assigned in the past three months. The average FTXL stock price target of $90.59 implies 2% downside potential from current levels.
Cost Comparison
In terms of fees, SOXX’s expense ratio of 0.35% is a better bargain than FTXL’s expense ratio of 0.60%. An investor putting $10,000 into SOXX will pay $35 in annual fees, while an investor putting $10,000 into FTXL will pay $60.
The differences in these fees compound and become more apparent over time. For example, assuming each ETF returns 5% per year from here, the investor putting $10,000 into SOXX will pay $443 in fees over the next 10 years, while the investor putting the same amount into FTXL will pay $750.
Adding It All Up
These are both good ETFs that invest in strong stocks, and they have generated sizable returns for investors. However, the returns that SOXX has generated are substantially better than those of FTXL, and it charges significantly less in fees, making SOXX the clear winner here. Furthermore, TipRanks’ Smart Score system has a slightly more favorable outlook on SOXX’s top holdings, and analysts also see SOXX as having more potential upside, adding to SOXX’s edge.
